-
Person
Map enthusiast & creator
-
Cartography & GIS
Maps & Geodaten-Analysis
-
Webmaps
Interacting with geo data
-
Creativity
Design & Misc
-
Person
Map Enthusiast & Creator
My name is Laura and I'm a cartographer and map enthusiast. Ever since I have been to a tiny map shop somewhere in the middle of Sydney and stayed there for some hours I knew, that I want learn the craft to create visualisations with geo data and cartography. I especially enjoyed the applied assignments of my bachelor studies. My bachelor thesis consisted of a 3D printed tactile map to support visually impaired people - a subject I am passionate about. As part of my international master's programme I was lucky to acquire valuable experience which helped me develop and improve skills and knowledge. A selection of my pracitcal work can be found in the portfolio sections.EDP-Skills
Software
Adobe PS, IL, IDESRI ArcGIS SuiteQGISHxGN GMSC-KHxGN M.App EnterpriseOCADBlender/Cinema 4DMS Office, Mac iWorkTechnische Universität Dresden
Cartography & Geomedia Technique B.Sc.
Okt '12 - Mär '16
Bachelor's thesis: "Generalization of a 3D-map model to help with blind person‘s mobility"
TU Munich - TU Wien
TU Dresden - UT Twente
Cartography Msc.
Okt '16 - Mär '19
Master's thesis: "Development of a framework to design a map style across several scales and its implementation"
EDP-Skills
Programming
HTML(5) & CSS(3)JavaScript, jQueryVuePHP / SQLLeafletJS (Esri, Mapbox)OpenLayersD3JavaSDKPythonResearch
Götzelmann T., Eichler L. (2016): "BlindWeb Maps – An Interactive Web Service for the Selection and Generation of Personalized Audio-Tactile Maps". In: Miesenberger K., Bühler C., Penaz P. (eds) Computers Helping People with Special Needs. ICCHP 2016. Lecture Notes in Computer Science, vol 9759. Springer, Cham. DOI: 10.1007/978-3-319-41267-2_19
-
Cartography & GIS
Maps & Geodaten-Analysis
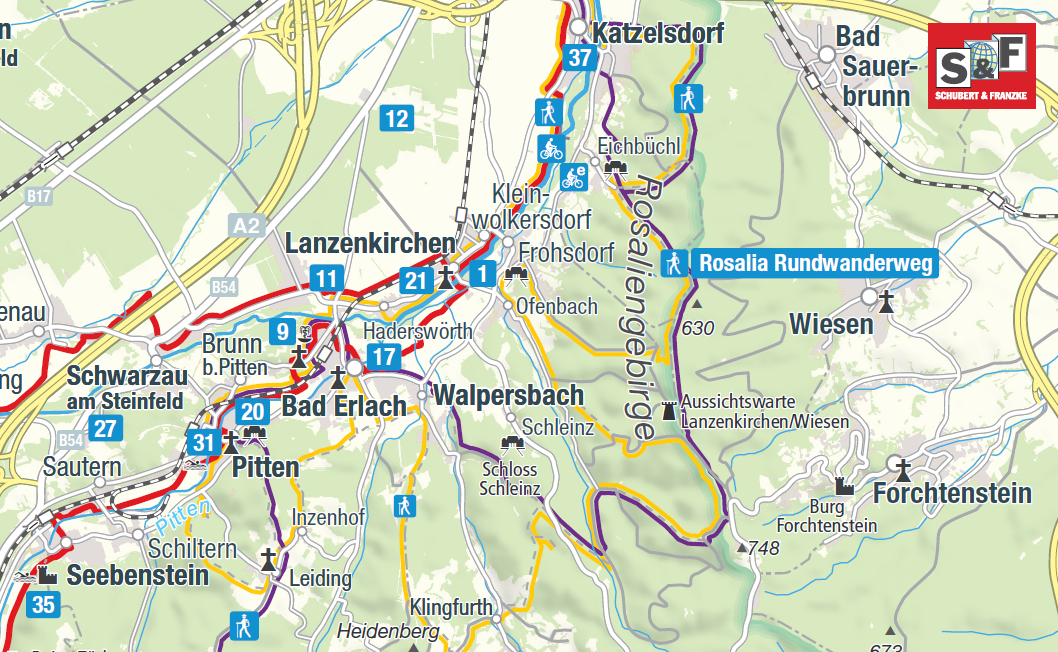
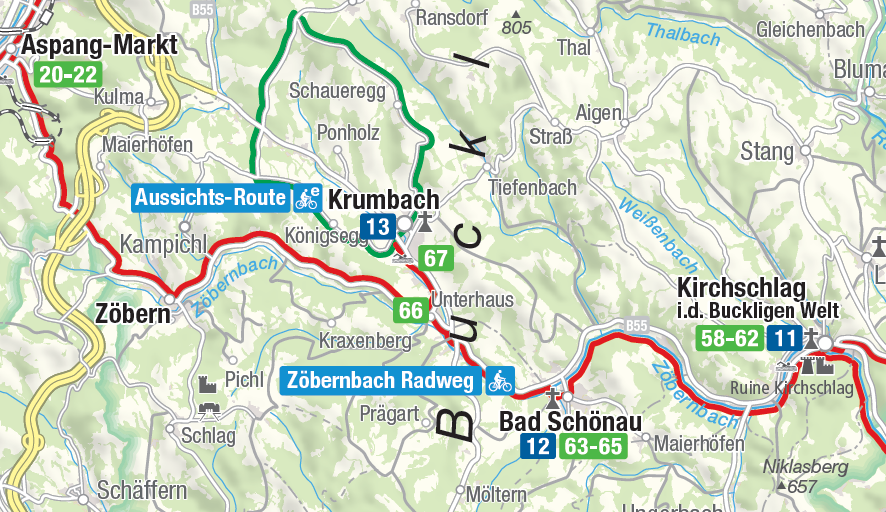
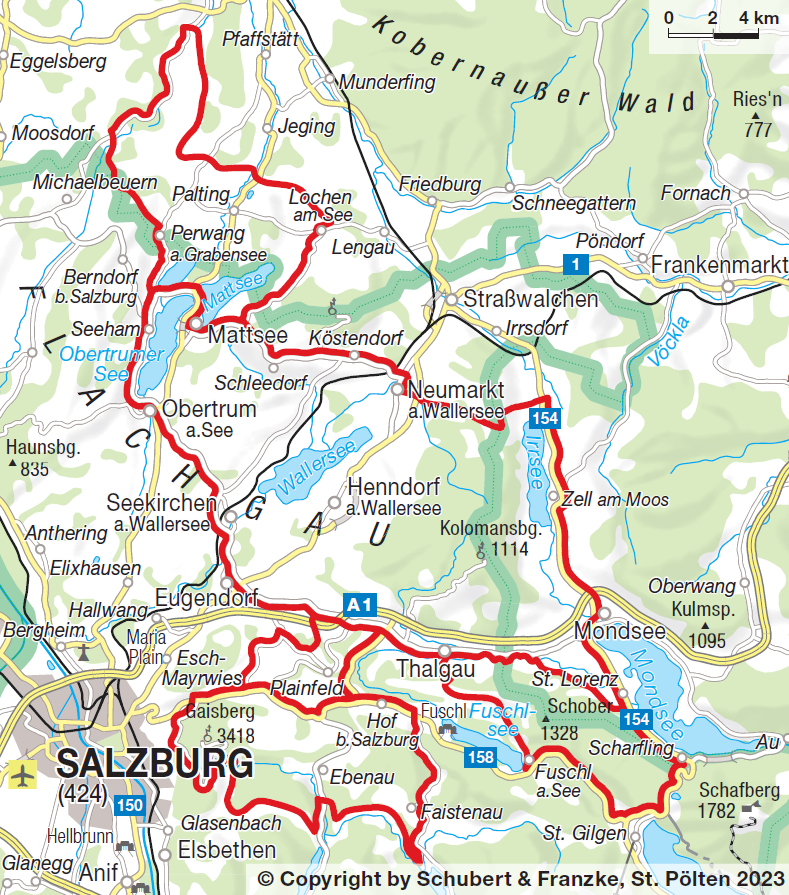
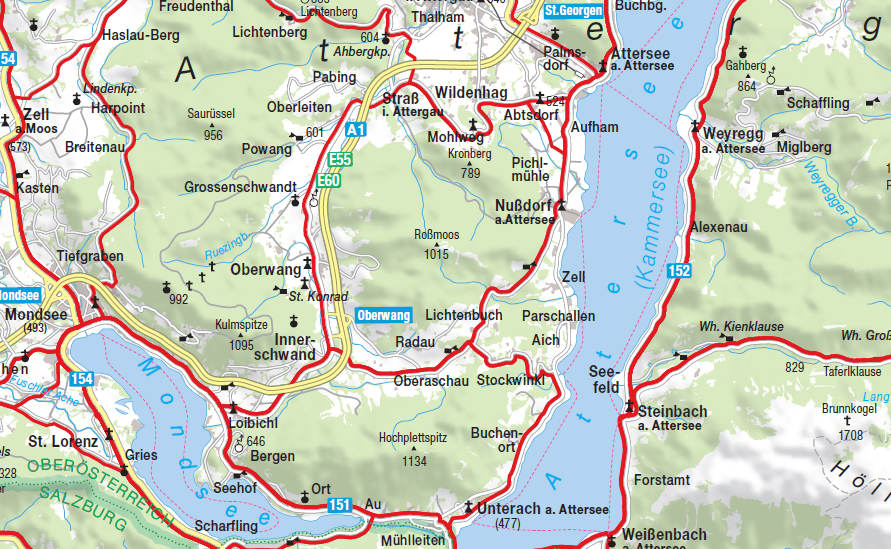
Favourite projects with Schubert & Franzke
Copyright by Schubert & Franzke - clippings with permission from the managing director T.B.
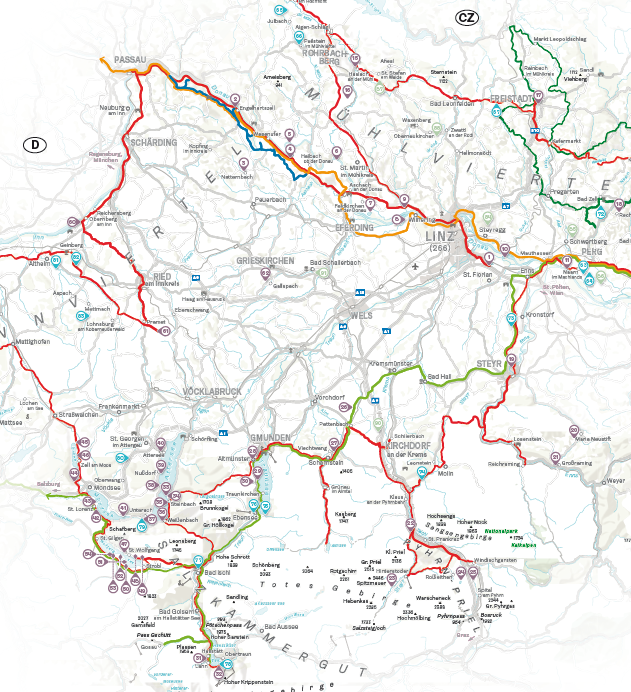
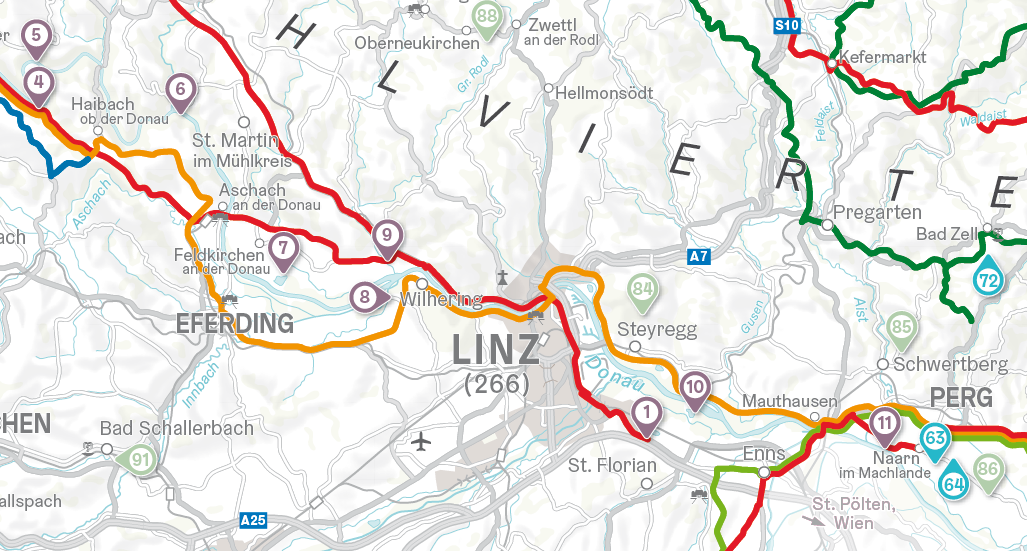
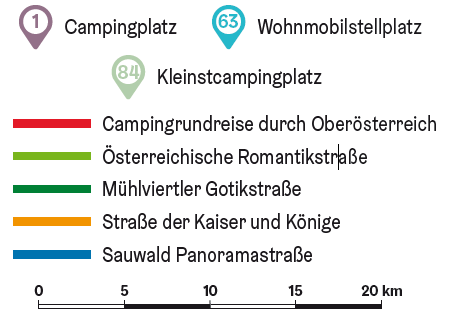
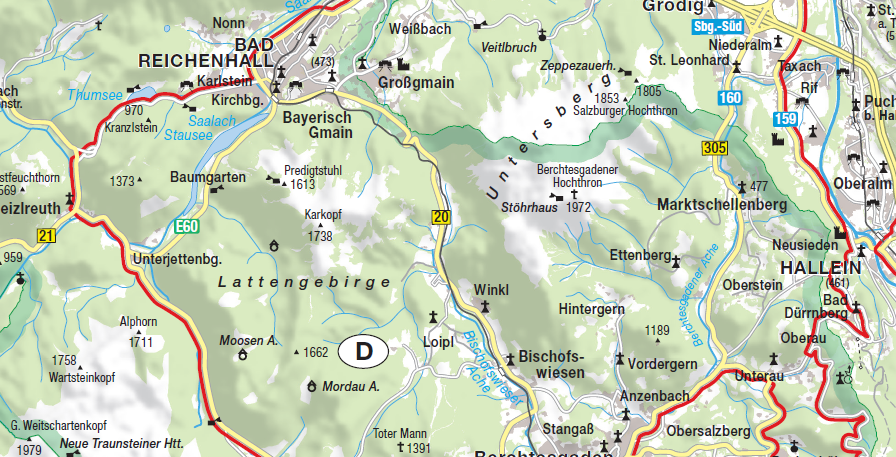
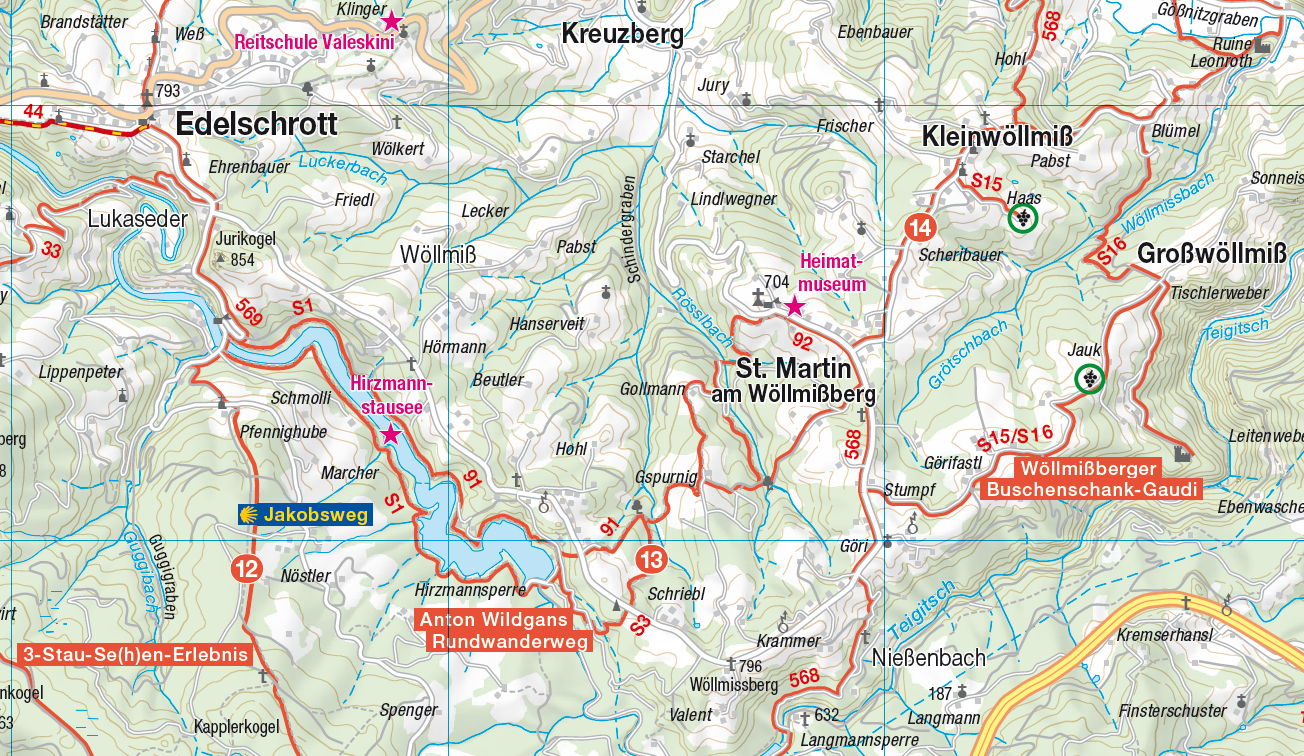
Camping map Upper Austria || Highly generalized and monochrome background map
One of the smallest scales I've worked on so far is the general map of Upper Austria and its camping and RV sites. By customer request, the map is extremely recessed so that the thematic routes pop out particularly well. This also makes the pastel-coloured markers on the map more legible. All fonts have the corporate design font requested by the customer, so that deviations from our normal map image have also been created here.
The map looks tidy and fits well with the rest of the product.
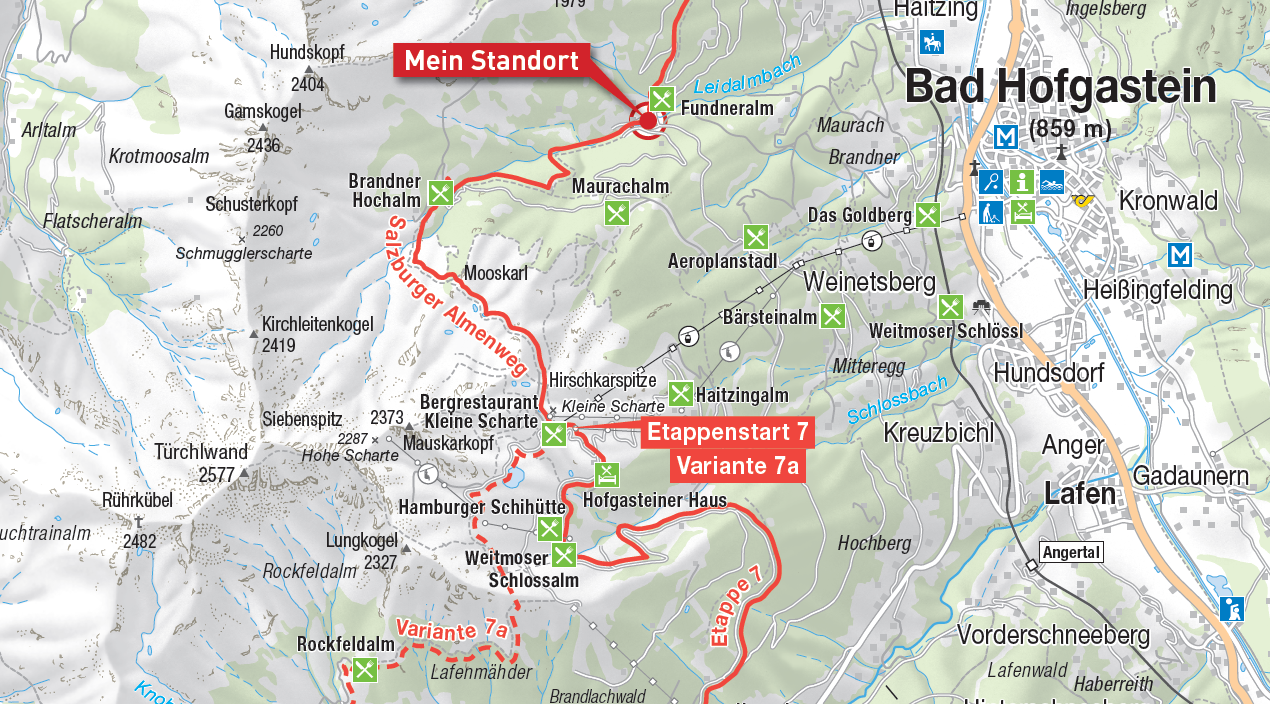
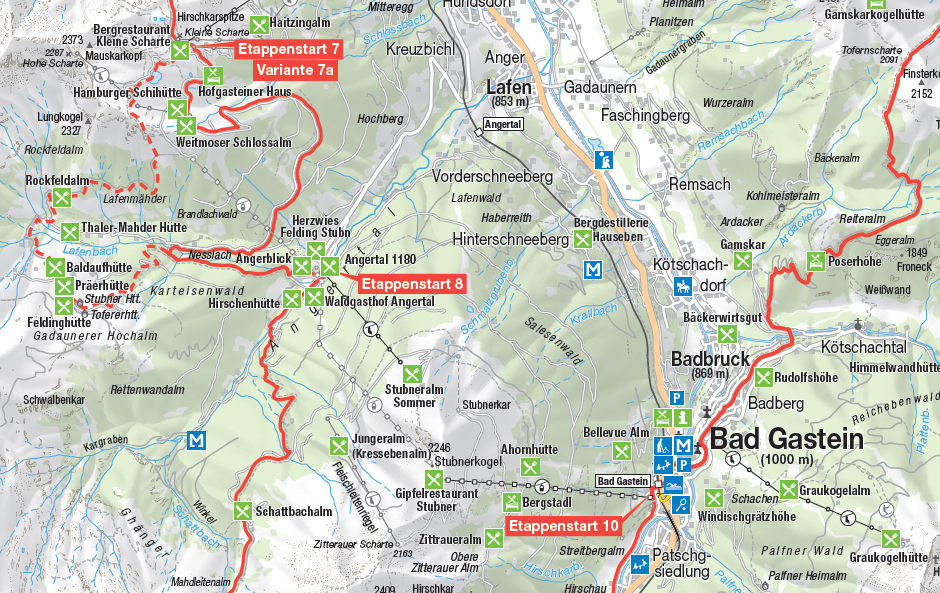
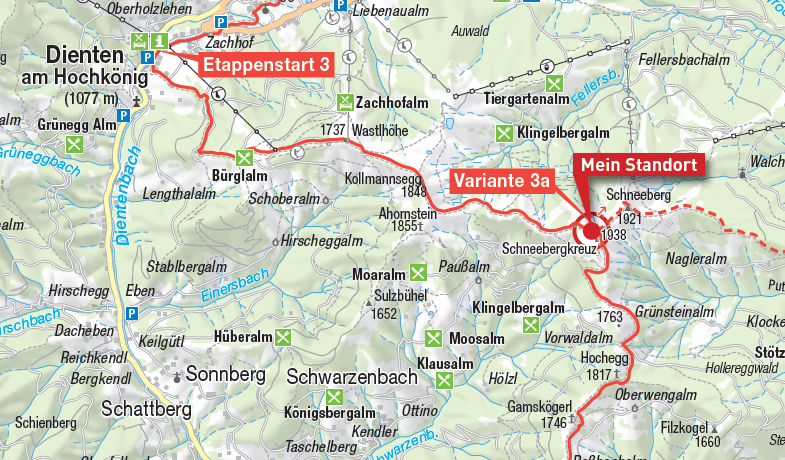
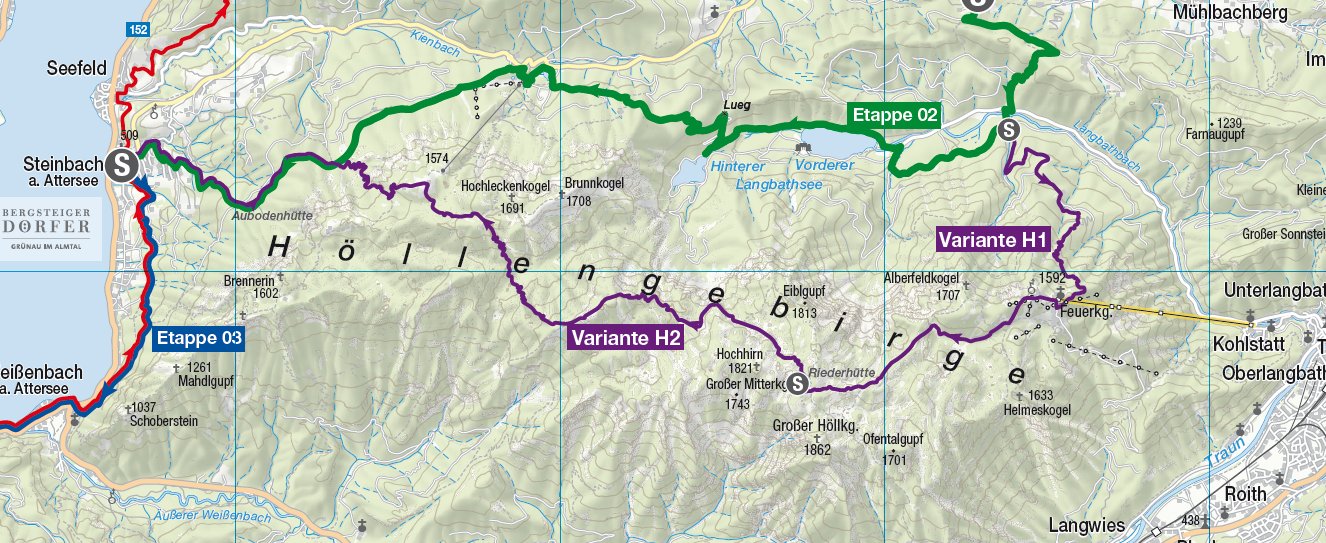
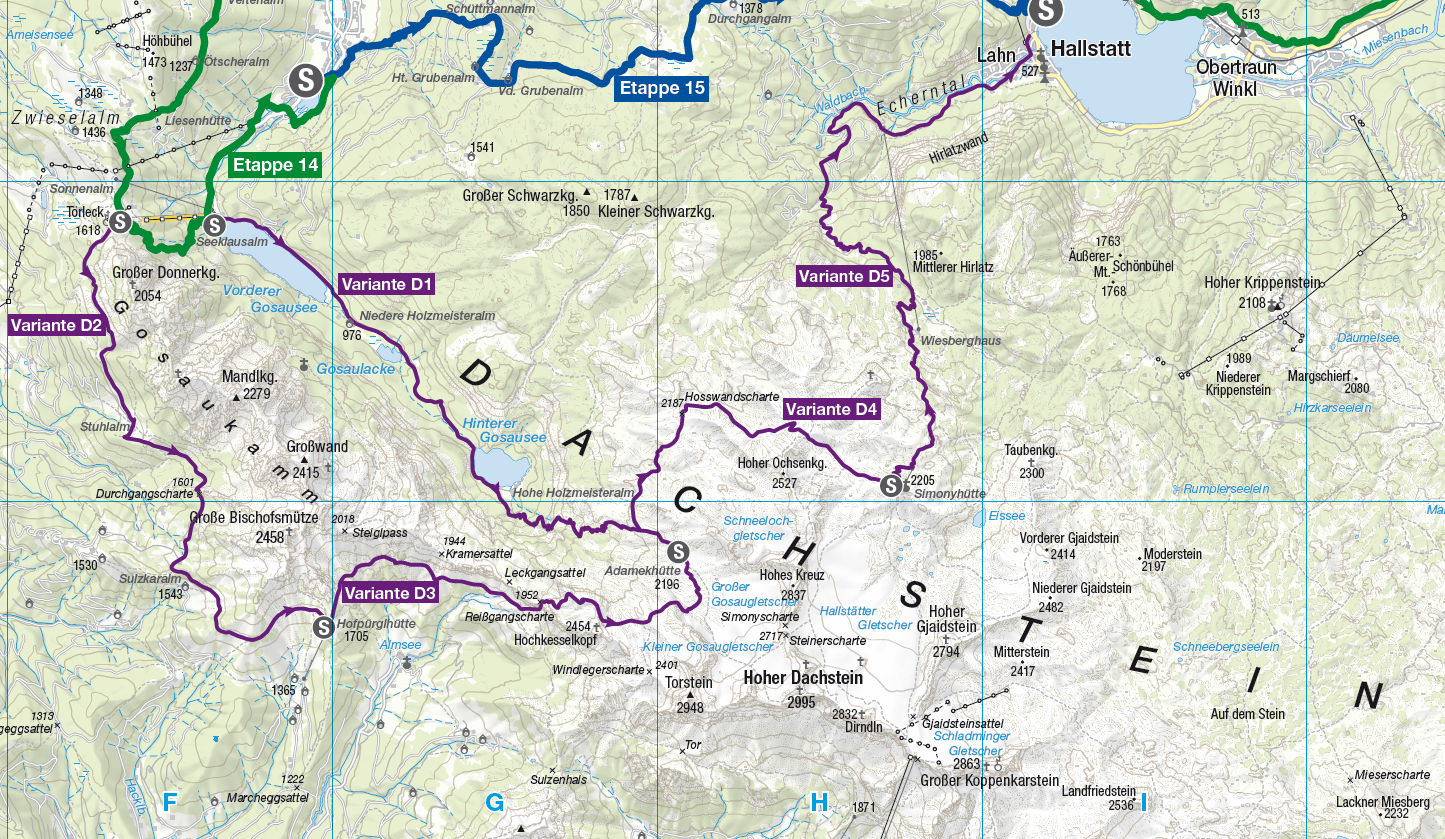
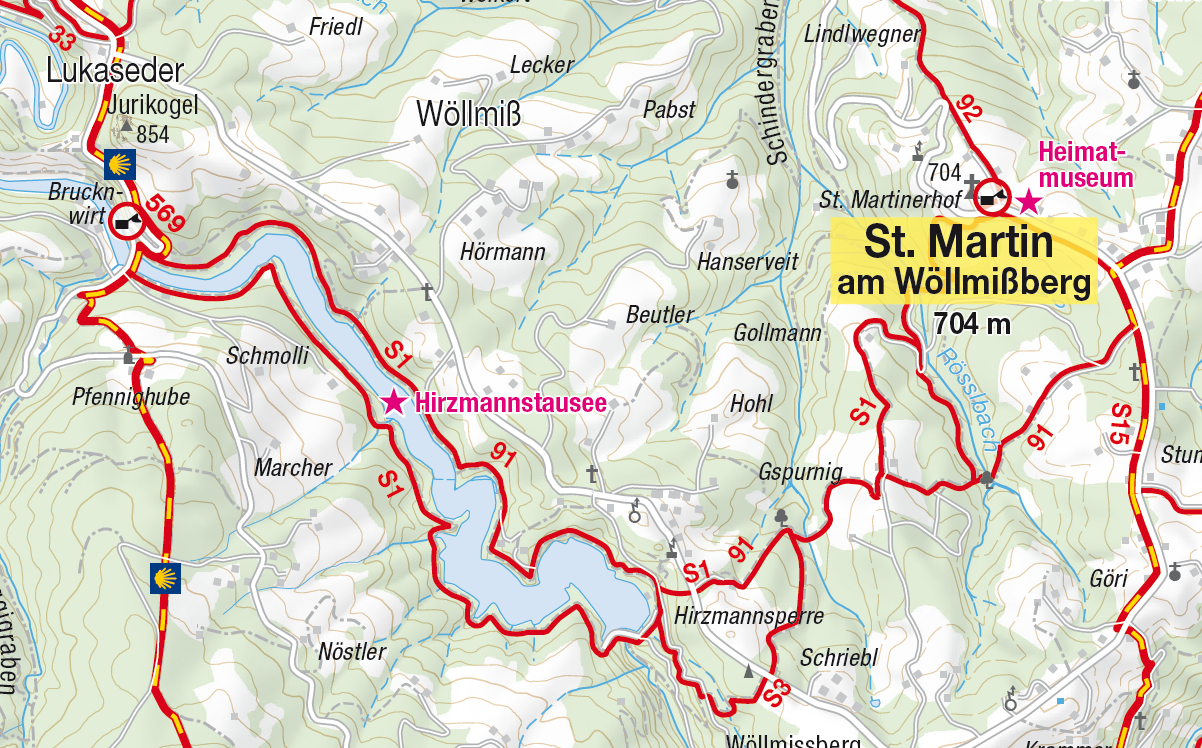
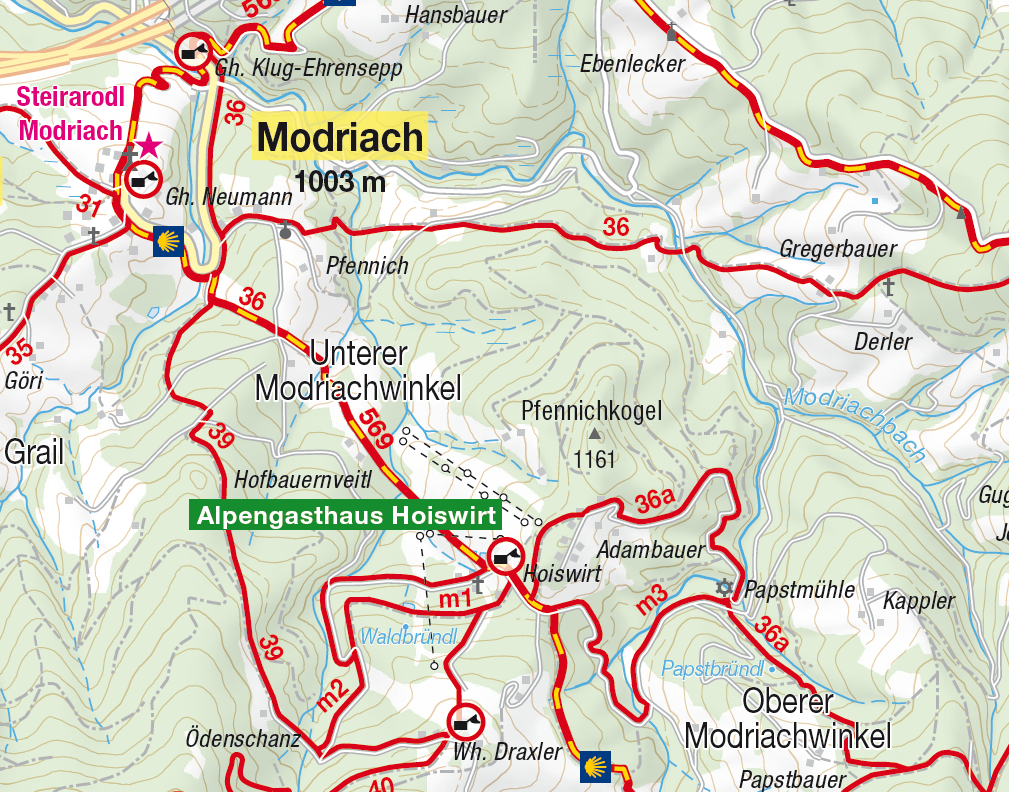
Salzburger Land Almenweg || 8 map sections, 1 sheet section map, 29 individual elevation profiles, approx. 55 different panels and an overview map
The Salzburger Almenweg is a long-distance hiking trail with 25 stages and 4 stage variants around the Salzburg sun terrace and the Pongau region. The demands were great, but it was extraordinary fun to prepare the maps. The 8 map sections, each in German & English, the sheet map and the individually labelled altitude profiles in German & English are for a hiking atlas. The approx. 55 different location boards are set up along the stages to help with orientation at alpine pastures and places with difficult trails. At the starting point is another panel showing the first and last stage as well as a rough overview map of all stages.
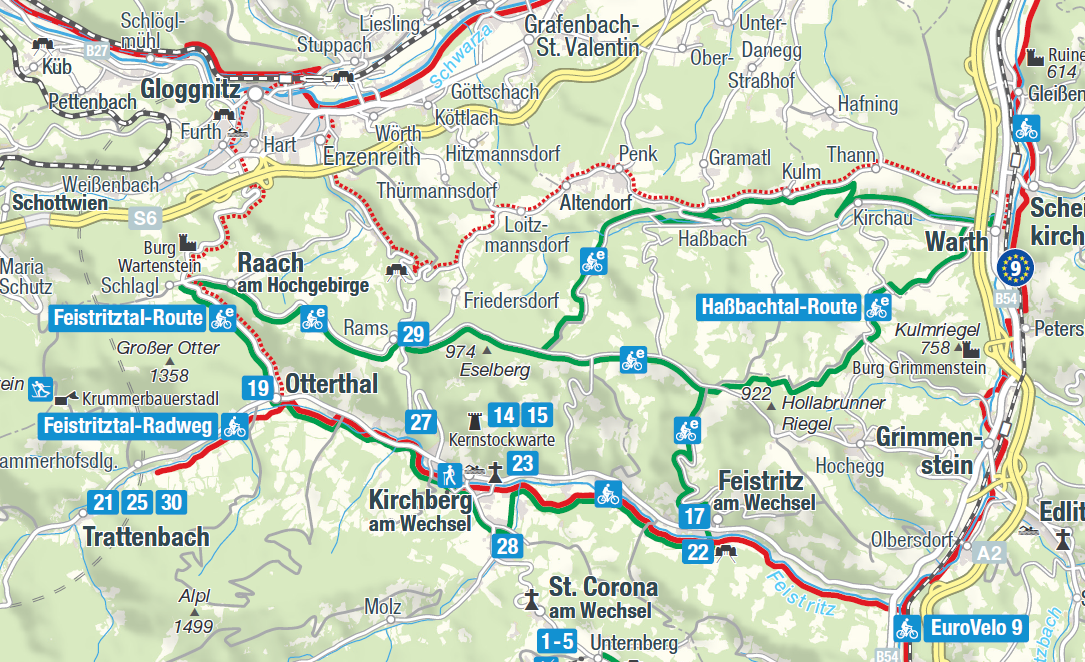
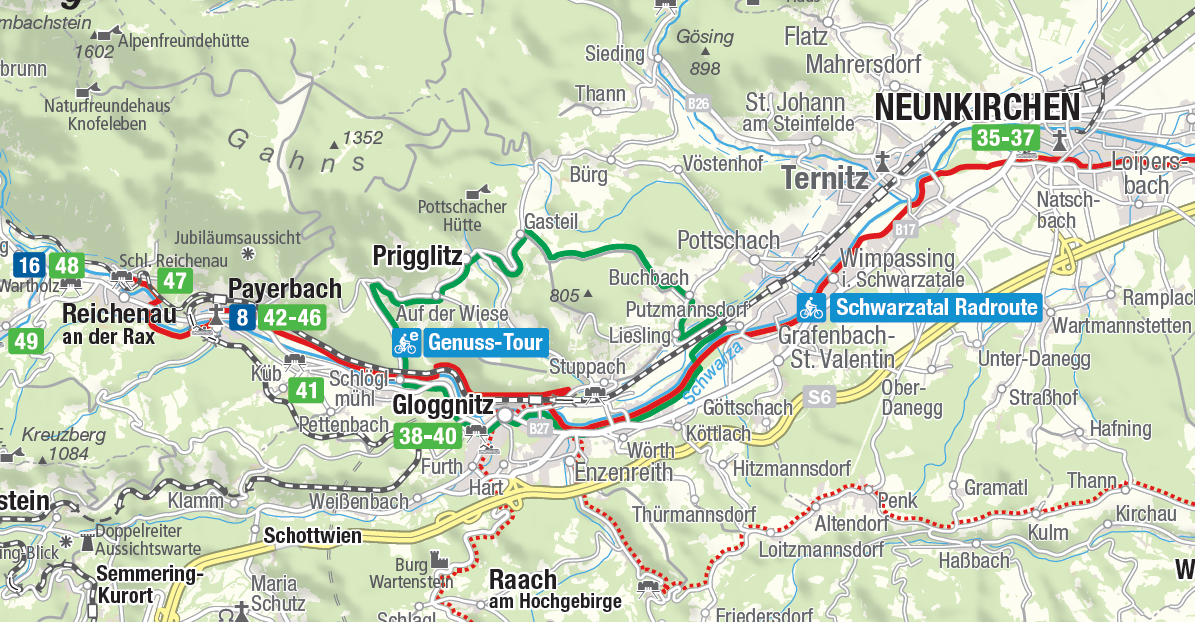
Viennese Alps || General map & map sections for a brochure
For the Viennese Alps, in addition to an entire overview map, several sections should also be created that differ in content. Here again, special care should be taken that no truncated inscriptions are visible in overlapping sections. I like the sections very much because the map on the whole looks very friendly and the colours harmonise well with each other, even though most of the colours were given.
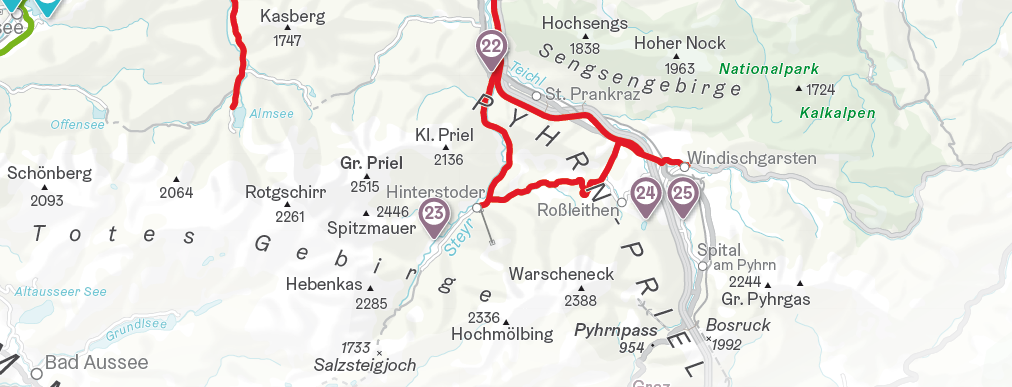
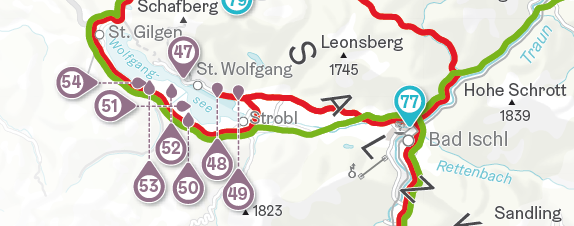
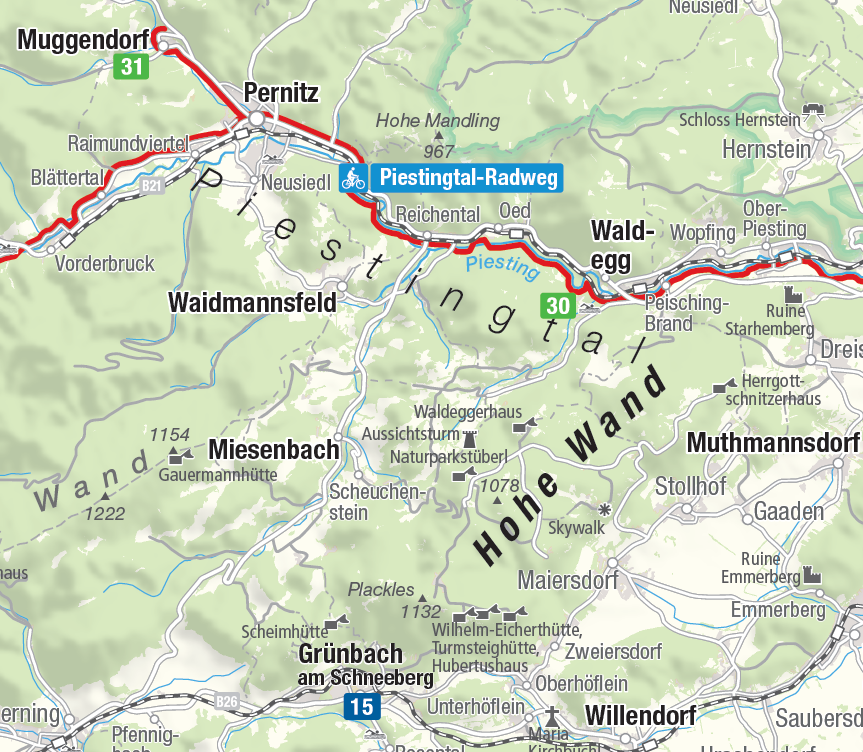
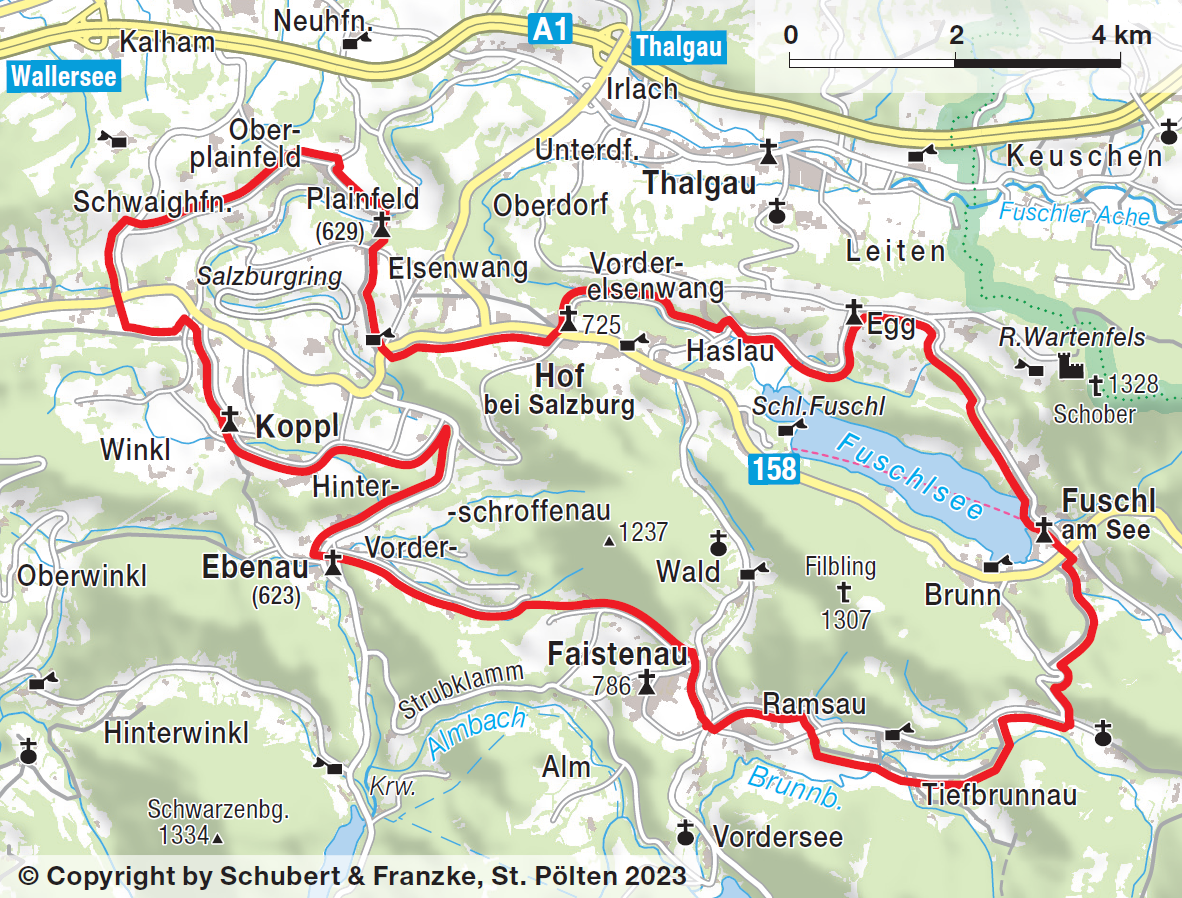
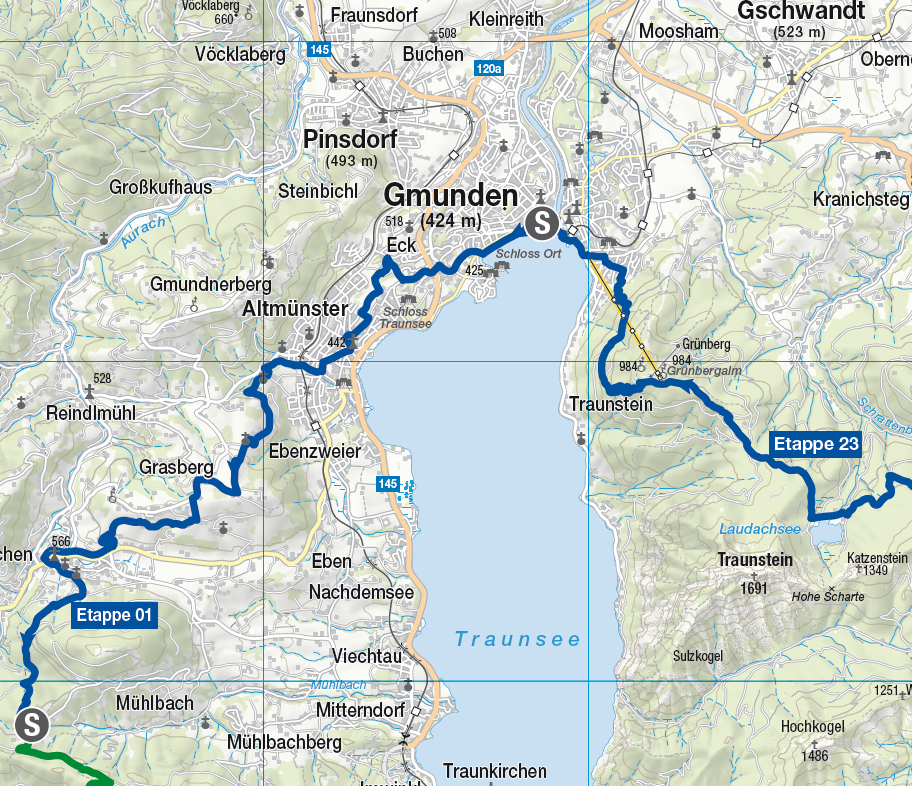
Racing Cycling Region Salzburgerland / Salzkammergut || General map with cycle path network and detailed maps
This map series was a challenge, because in addition to the usual leisure map, which served here as an overview map of the cycle path network, 25 detailed maps for individual racing cycle routes were also required. Due to their different courses and lengths, there are of course different scales, which can also change the data basis. With the number of detailed maps, it doesn't exactly make the task easier. However, it was fun to optimally fulfil the different requirements.
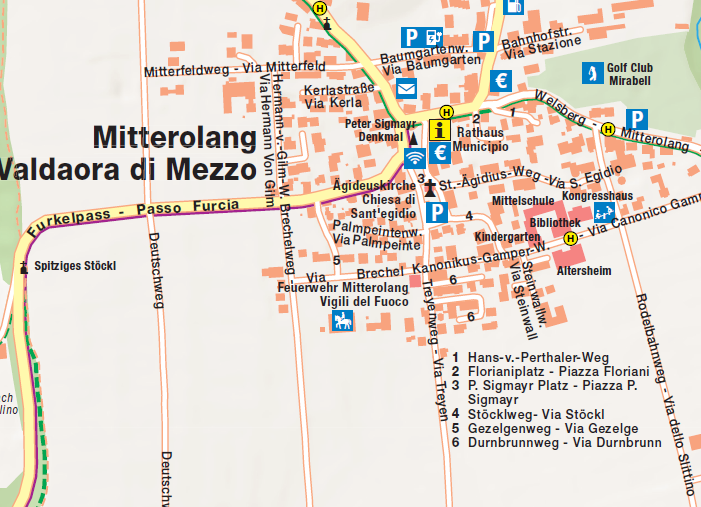
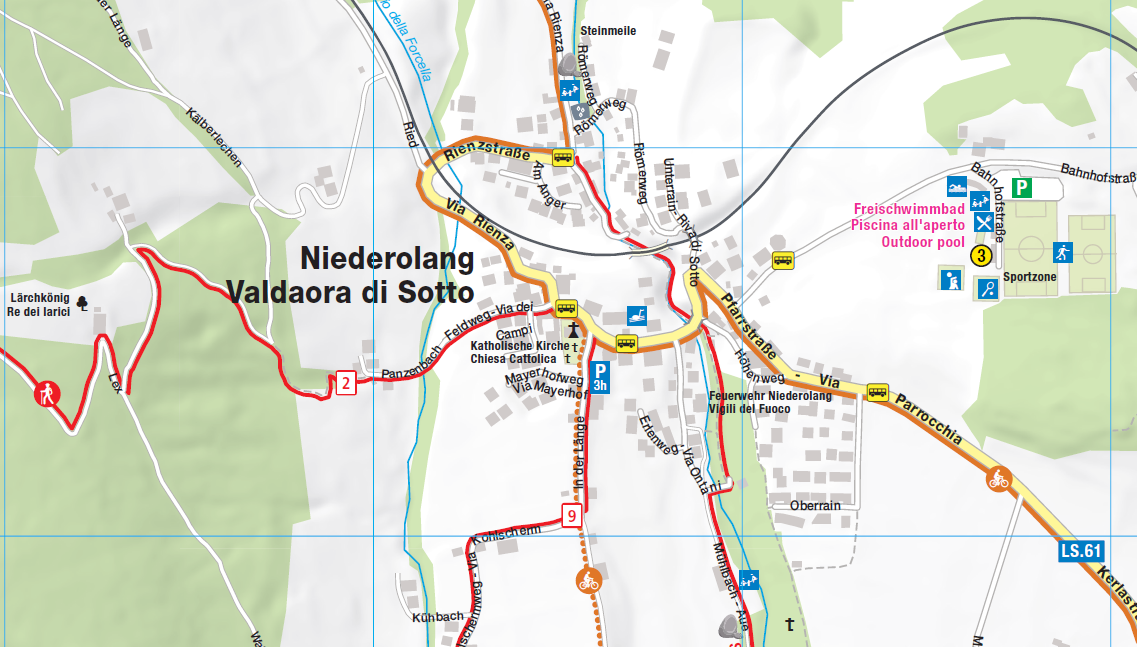
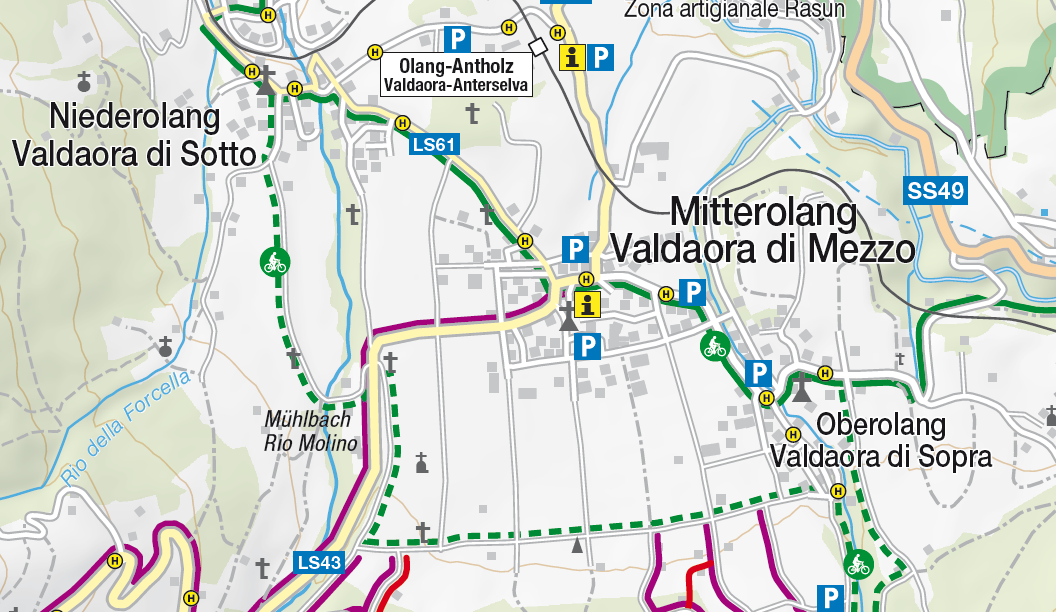
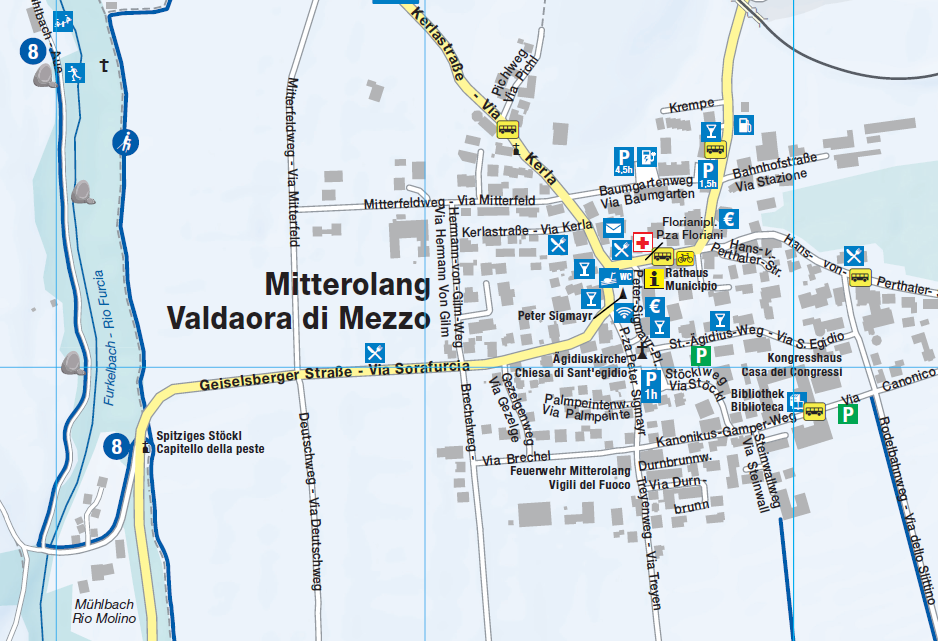
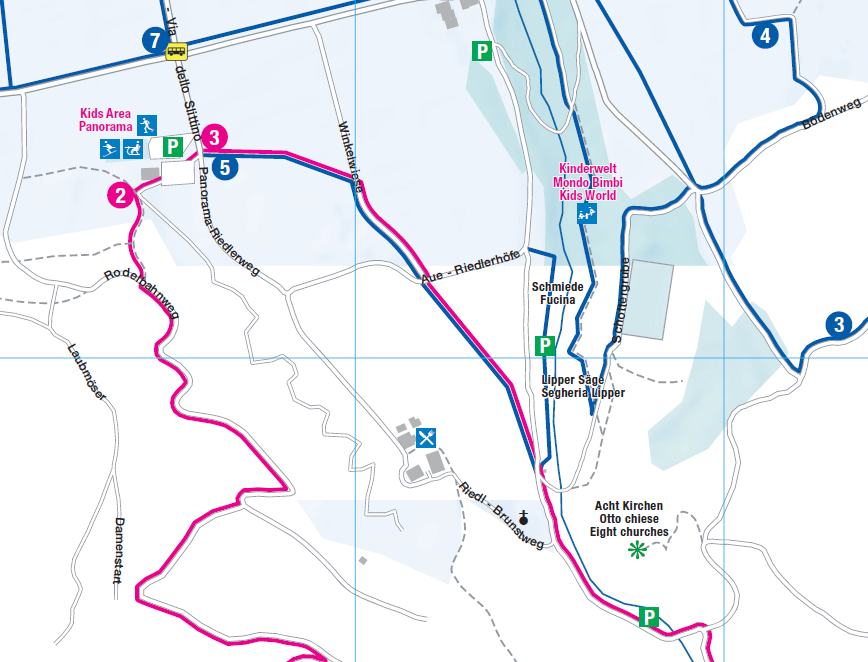
Olang Valdaora local map || Local map, bilingual
The local map of Olang/Valdaora in South Tyrol contains a summer map as well as a winter map. It is special for me because I was able to try out a new technique of production and because the map contents are given in German and Italian. This makes the written placement of streets and POIs in city centres challenging. The summer map shows hiking, cycling and mountain biking routes. On the winter map there are winter hiking trails and snowshoe trails to discover. City maps with leisure content are not the norm, usually there is a city map and an associated leisure map on a smaller scale.
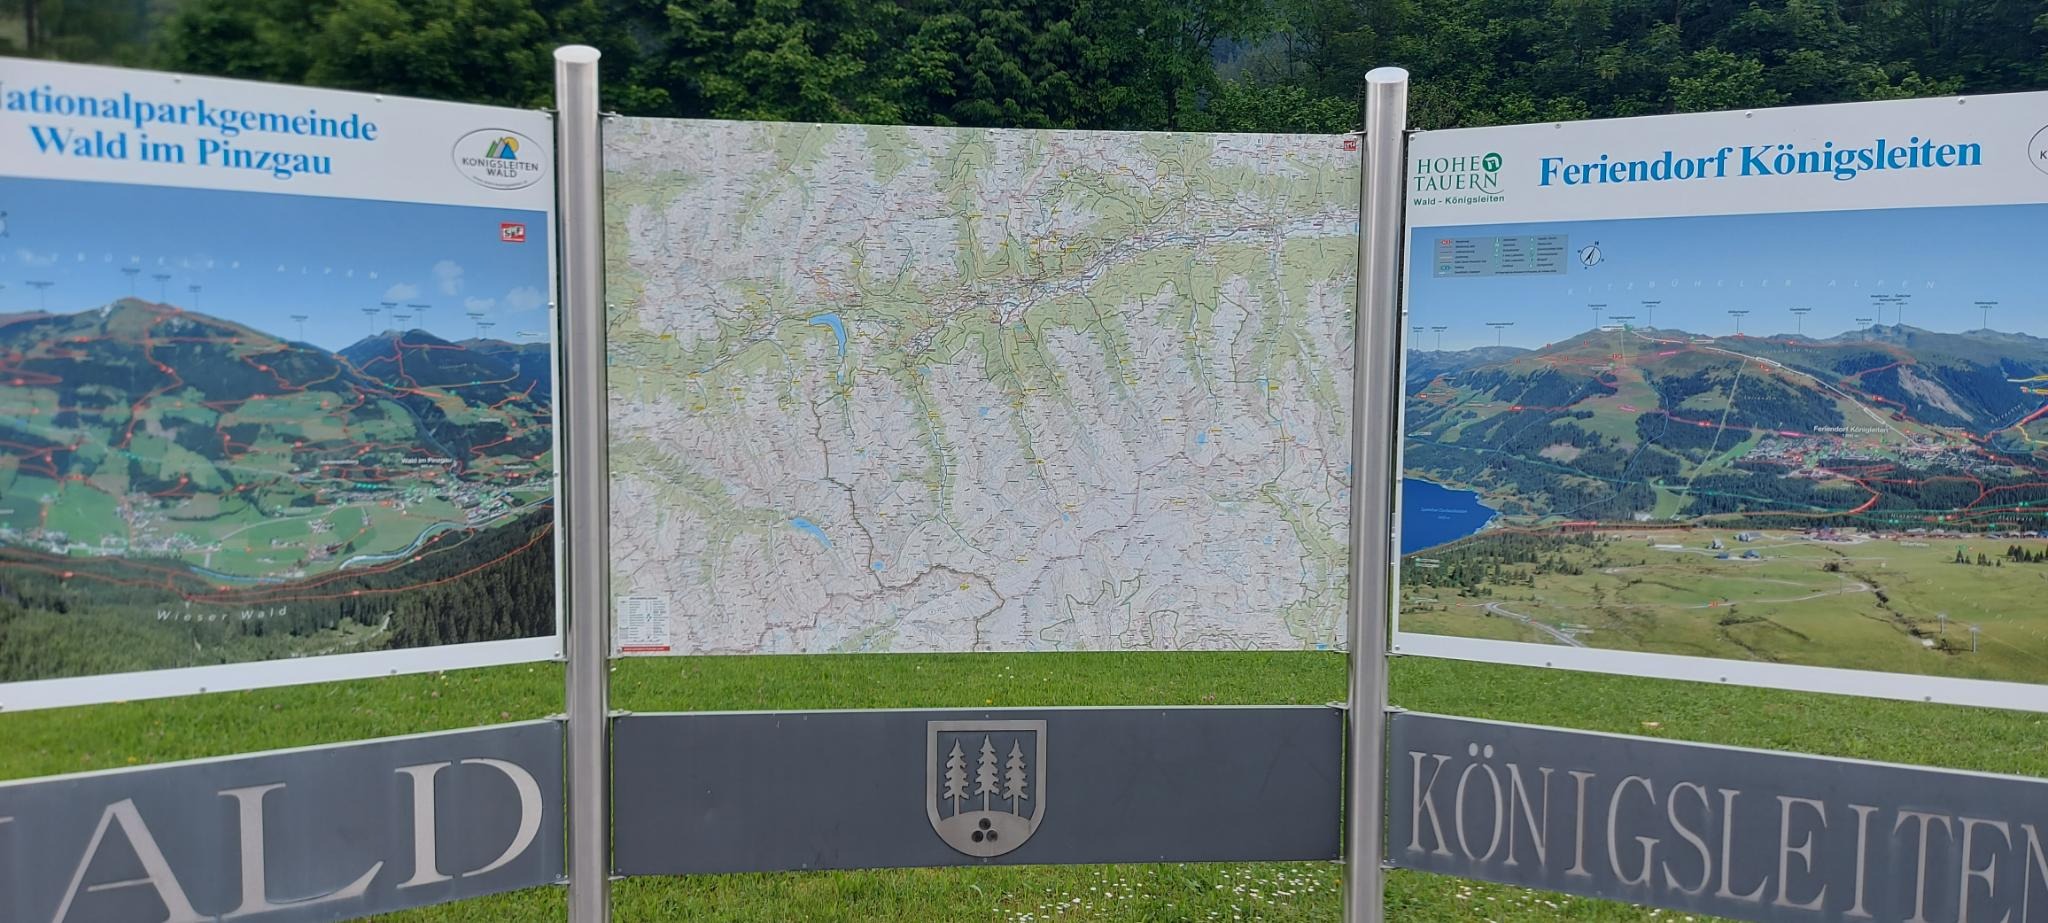
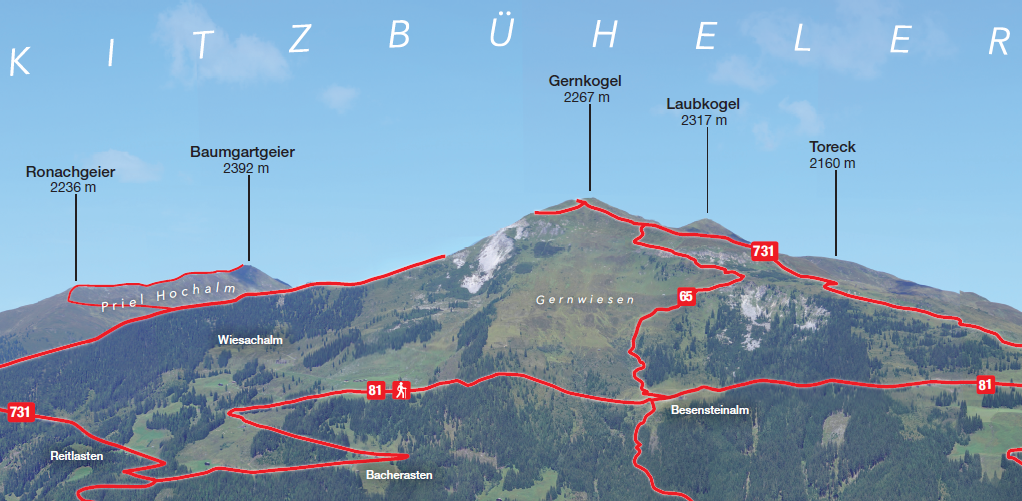
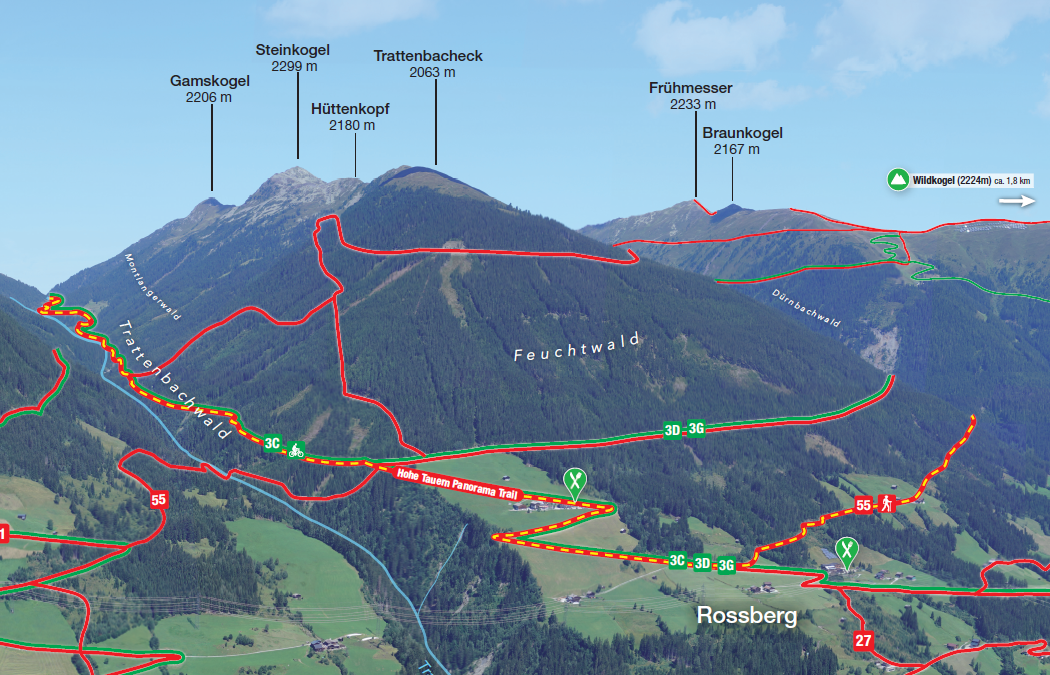
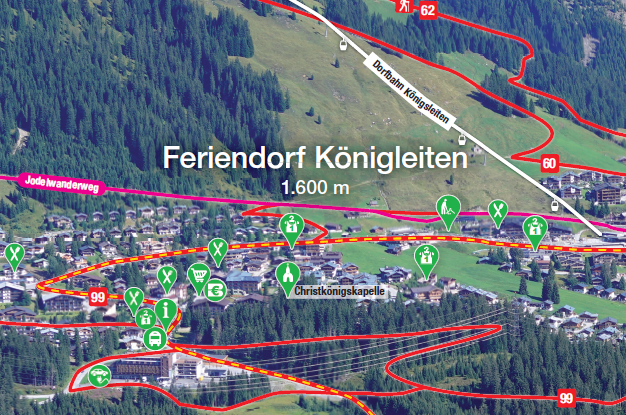
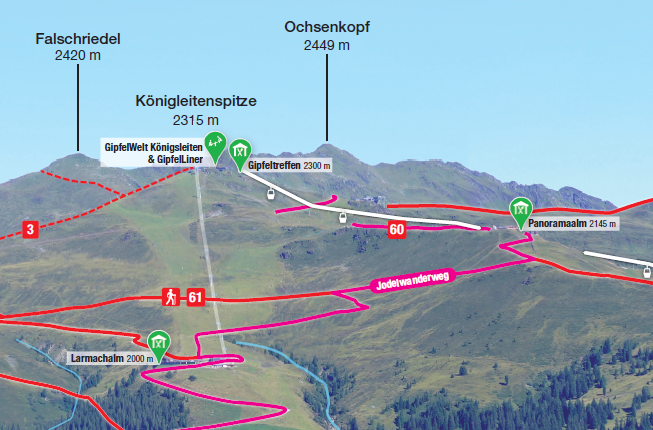
Aerial panorama Wald im Pinzgau / Königsleiten || A mountain panorama made from drone images with leisure themes
.In the summer of 2022, I was allowed to travel to Pinzgau with an external company and be part of the shooting with drone. An exciting and everyday-breaking experience. I received the resulting images as raw data, which I then edited and edited together to provide a good basis for map content. Even though it is not a map in the conventional sense, the same elements are labelled and displayed. I was allowed to work out the design concept on my own and I am very satisfied with the result, because here, too, different requirements apply than with our conventional maps. For example, POIs are not displayed as square symbols but with pins. Mountain peaks and mountain ranges are labelled in the sky on the map. National roads, waterways and railway lines are traced. Hiking and cycling routes are broken down thematically.
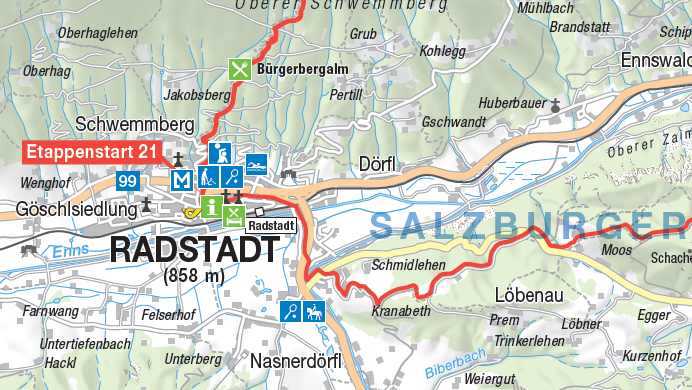
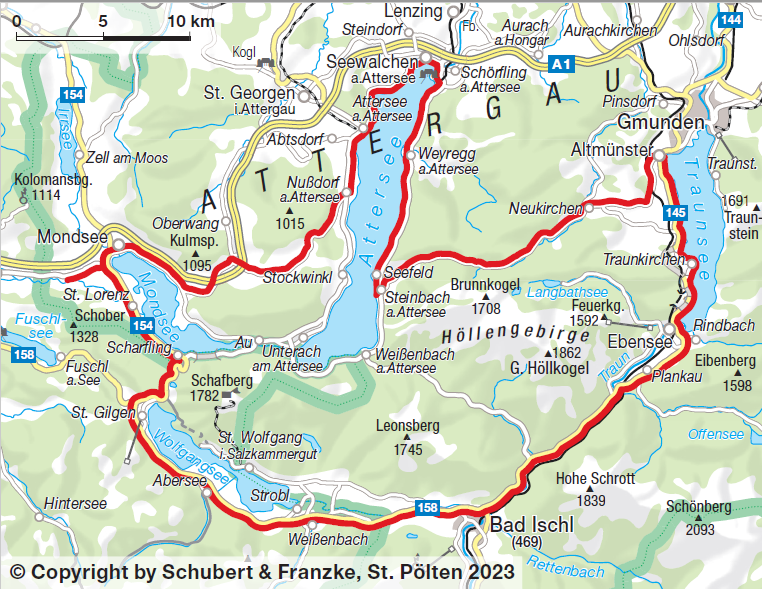
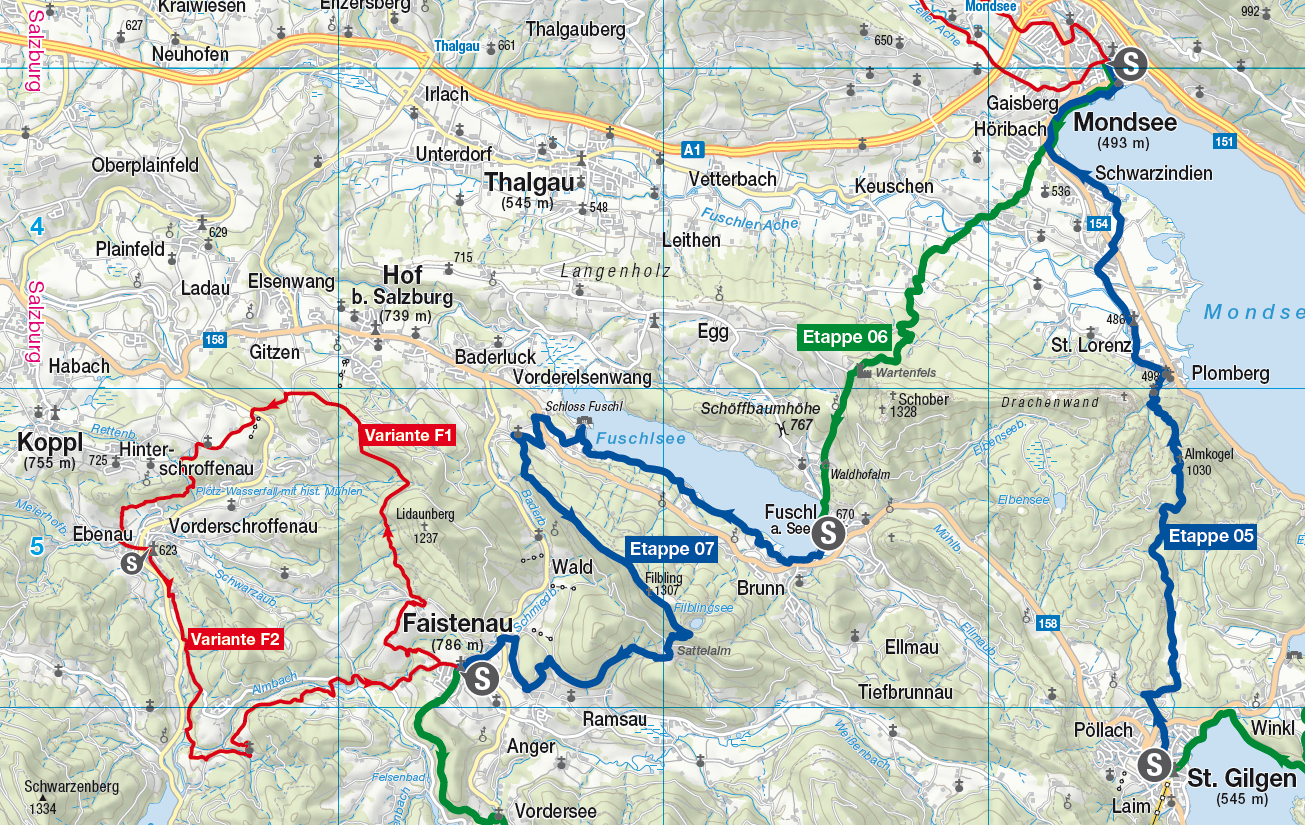
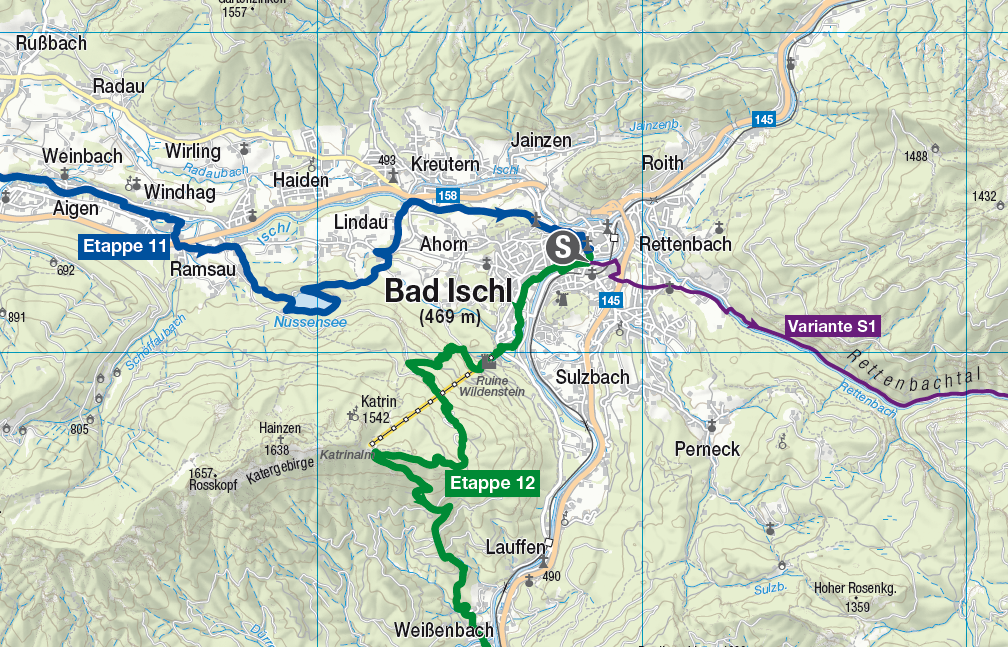
Salzkammergut Mountains Lakes Trail || Recreational map of the 21 stages
.This map is really my favourite. It's tidy, clean and the subject matter is easy to see and label. The stages are alternately coloured while regional and alpine variants are colour-coded again. In addition to the map, I also created the altitude profiles, which are given on the back with the stage description.
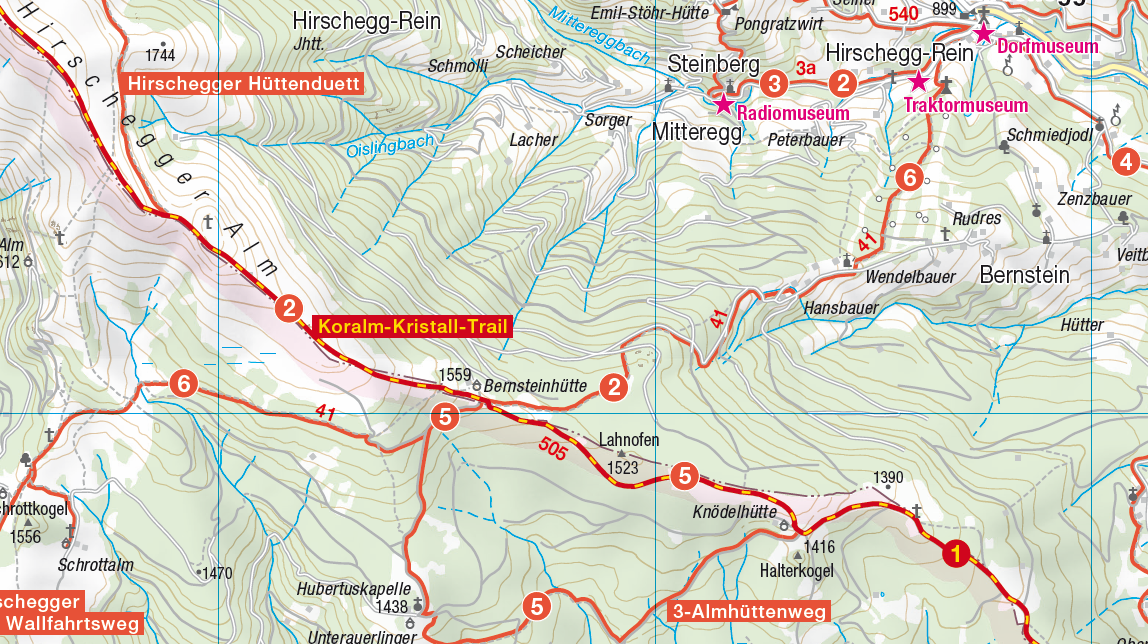
Hiking atlas Steirische Rucksackdörfer || a small brochure with several maps
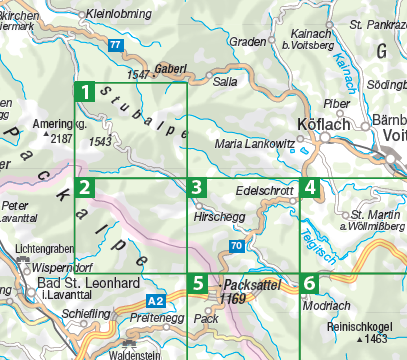
.At Schubert & Franzke, we attach great importance to leaving the edges free, i.e. there are no cut inscriptions on the map edge or around the legend or other map elements. The special feature of this brochure with overlapping map sections is that the lettering must be visible in one section but not in the other. Or that the lettering is positioned differently on one map than on the other. In addition to the walking atlas, there was also a folding map of the entire area as well as a location board that was set up on site at various locations. A consistent map image with attention to detail accounts for much of the quality of the map.
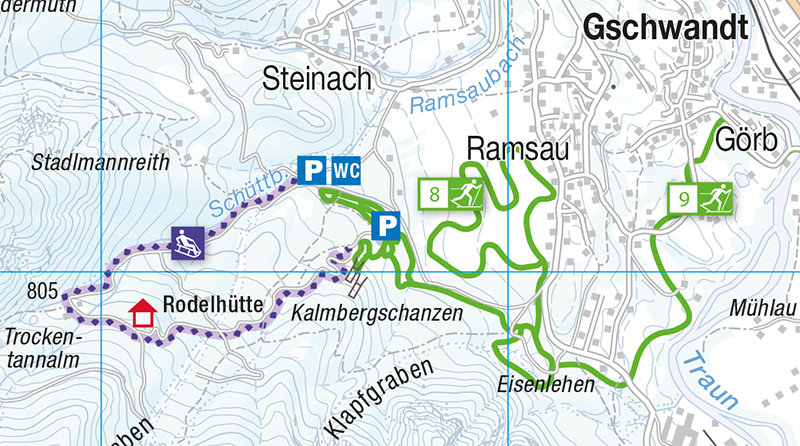
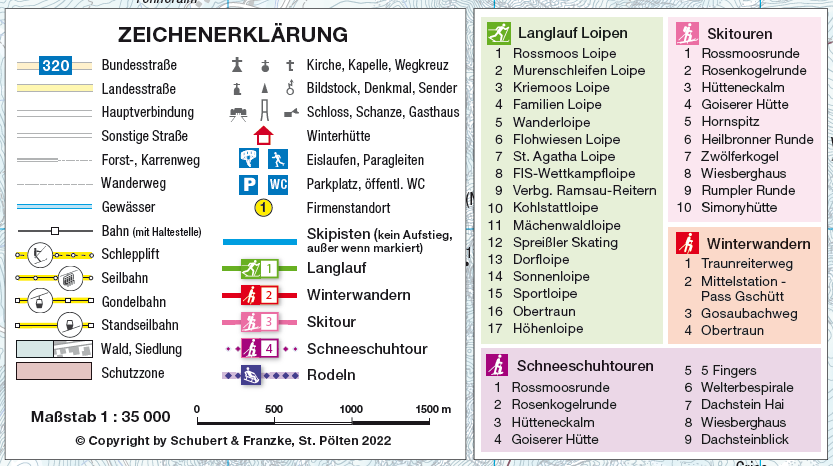
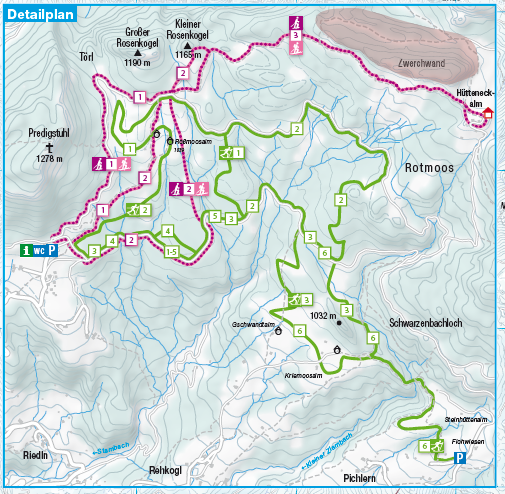
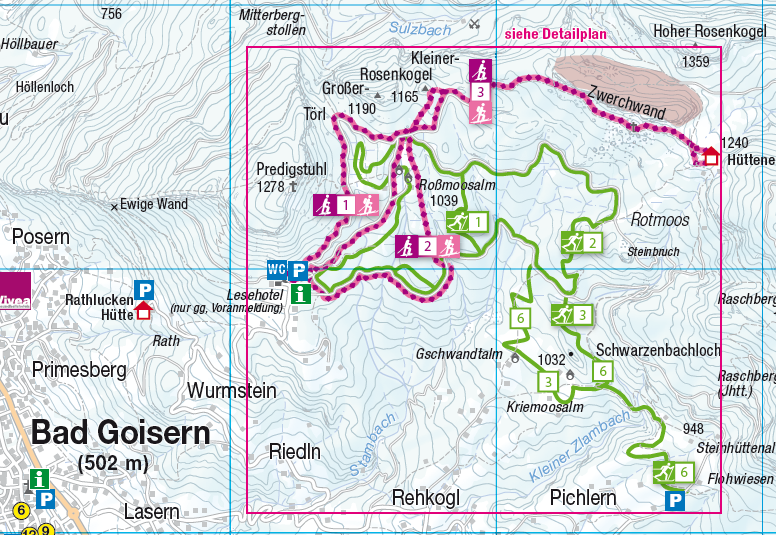
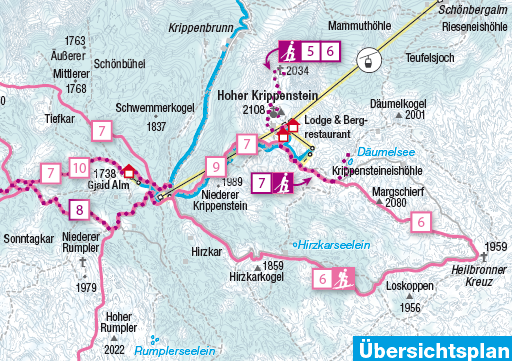
Dachstein Nature Experience Map || my first winter map
In addition to the summer map with cycling and hiking trails, the Dachstein Nature Experience Map also has a winter map with snowshoe tours, winter hiking trails, ski tours and cross-country ski trails. This winter map was my first and is divided into 3 different scales. There are again special features of the colour choice, as the background map is not green/warm but blue/cold. I like the overall design of the colours and signatures, as well as the symbolisation of the tour numbers.
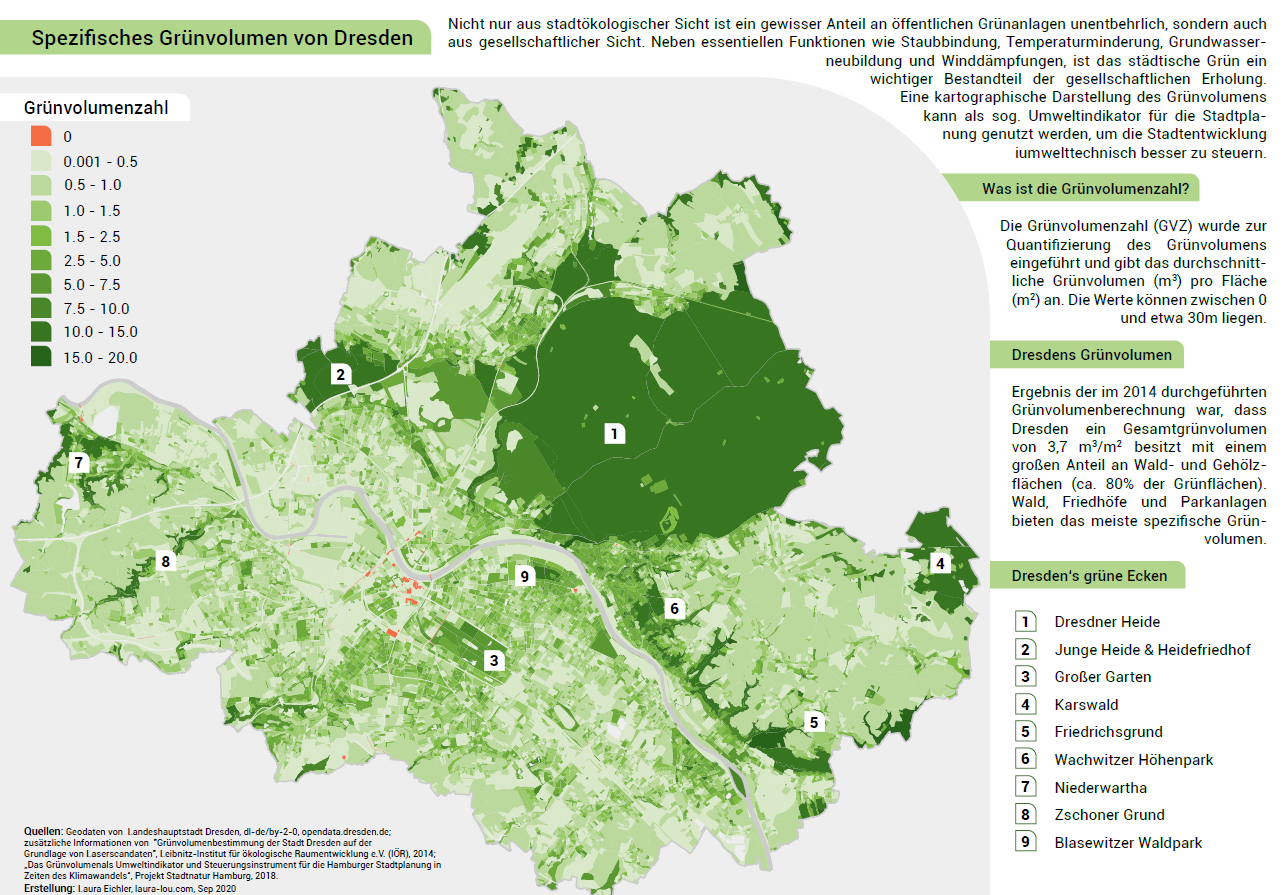
Specific Green Volume Dresden
The Green Places of the City
QGIS | Adobe Illustrator
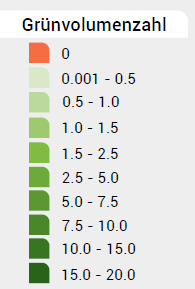
The Leibnitz Institute for Ecological Spatial Research has conducted a study on behalf of the Environmental Agency of Dresden, how large the green volume of the city of Dresden is. The results are shown in this map. The green volume number (GVZ) was introduced to quantify the green volume and indicates the average green volume (m3) per area (m2). The values can range from 0 to about 30m. The result of the green volume calculation carried out in 2014 was that Dresden has a total green volume of 3.7 m3/m2 with a large proportion of forest and wooded areas (about 80% of green areas). Forest, cemeteries and parks provide the most specific green volume.
Sources: Geodata from Opendata.dresden.de, further information by IÖR
Bike Tracks Map
Recorded Bike Tracks visualized on a topographic map (DIN A2)
QGIS | Adobe Illustrator
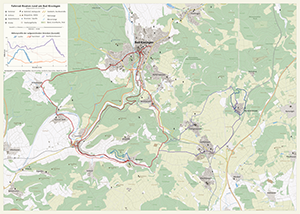
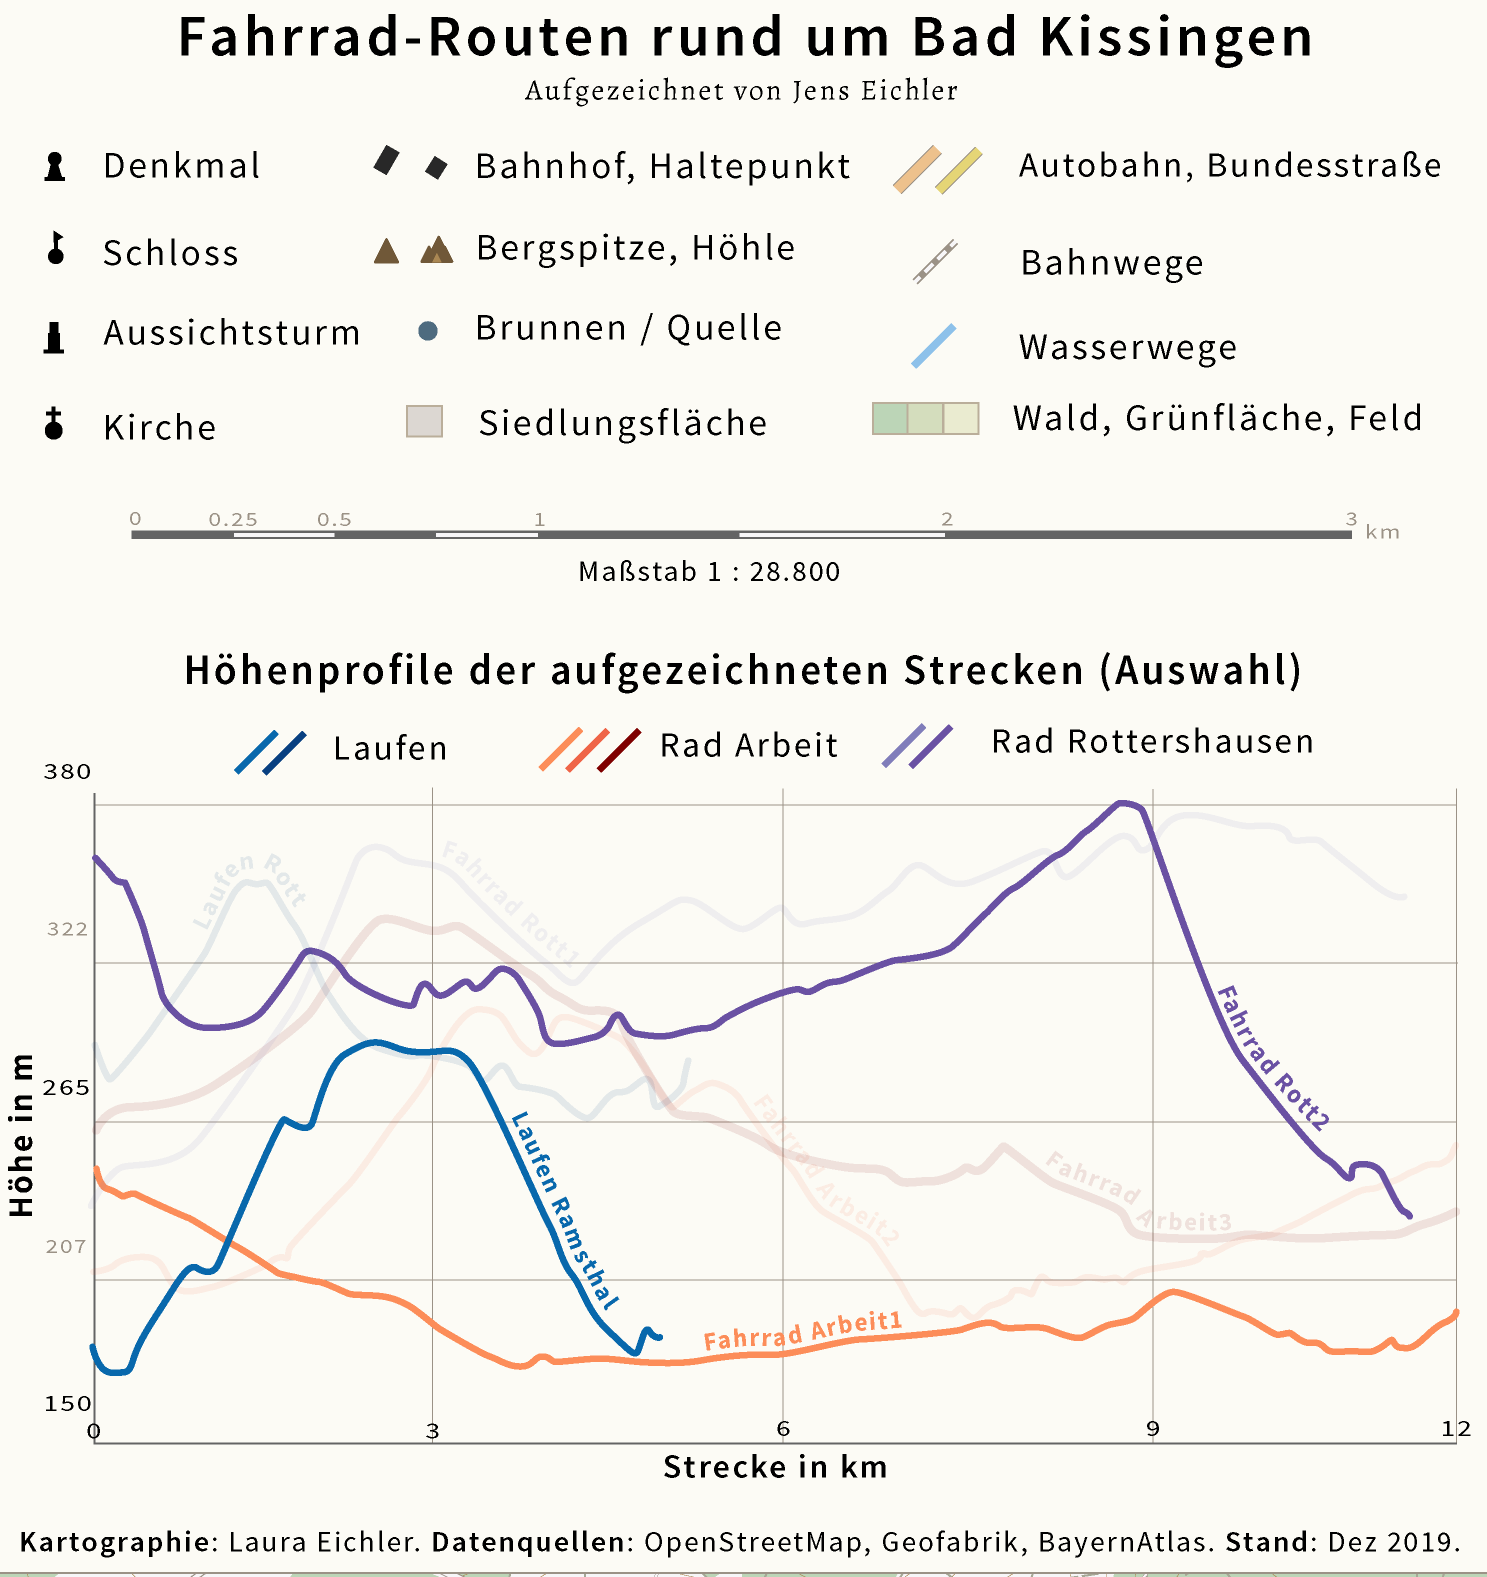
With the help of a fitness tracker and watch, the routes coordinates were recorded with lots of additional information such as height or distance. To visualize these on a map a topographic map style was selected and established. Few point symbols and height information indicate the surroundings. Furthermore, a height diagram of selected routes can be investigated to get an impression of the tours.
Sources: Shapefiles by Geofabrik; thematic information extracted from OSM and BayernAtlas
Hometwon Dresden
A personal map to show my favourite places in the city.
QGIS | Adobe Illustrator
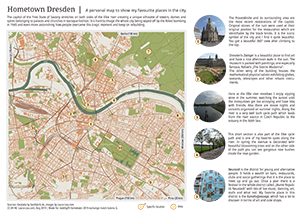
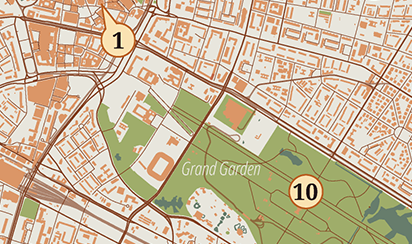
This is a project for a secret santa with the theme of "Hometown". I chose Dresden as I wanted to show my favourite places of the city I lived in for years. These are the locations I would show a stranger visiting for the first time. I deliberately did not place labels on the map to take up on the intend that I would show the person around and know the city by heart. Short paragraphs and pictures of mine as well as random facts give more information. Colors are inspired by Gretchen N. Peterson's "Cartographer's Toolkit".
Sources: Shapefiles by Geofabrik
{SPOILER!} The Journey of the Starks
Travel routes of the famous characters from HBO's "Game of Thrones"
QGIS | Adobe Illustrator
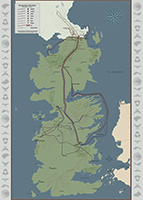
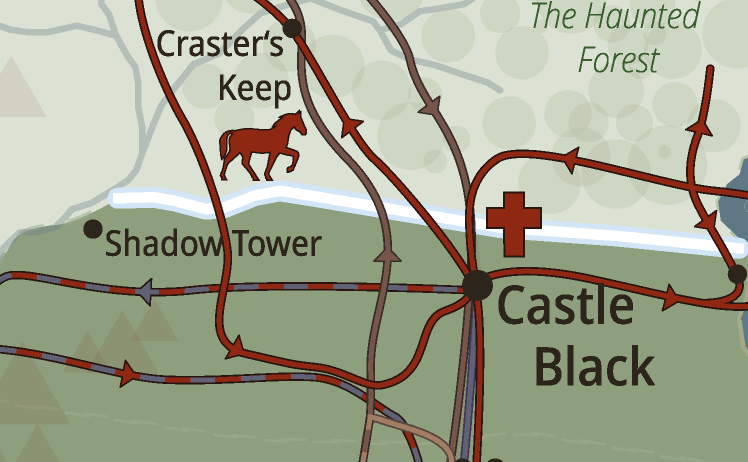
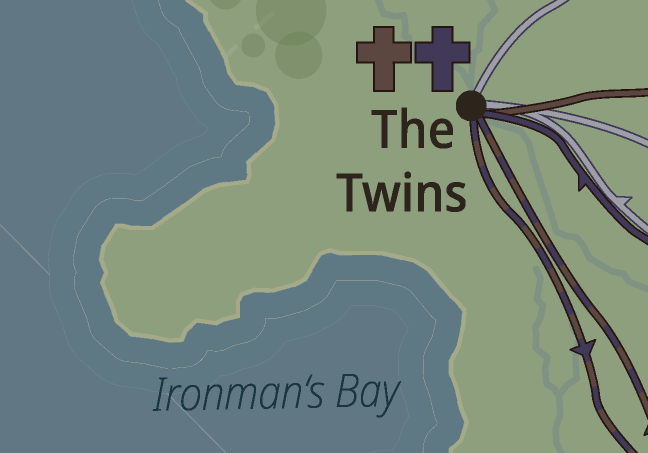
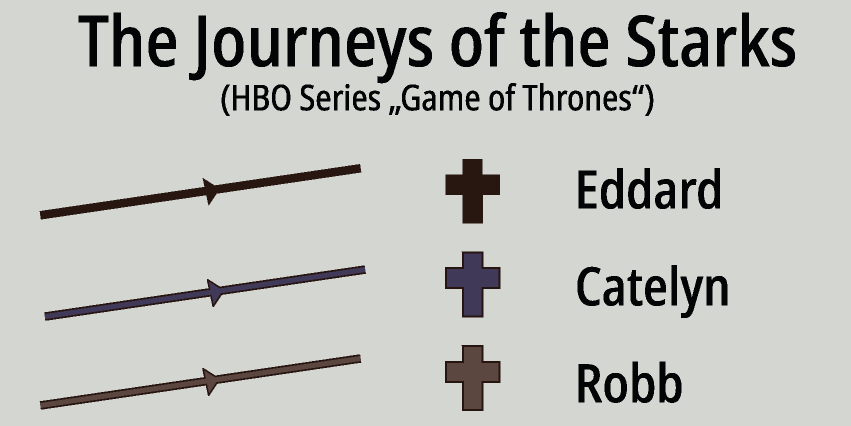
A secret santa gift exchange (topic "Game of Thrones") motivated me to create a map of my match's favourite character's travels around Westeros in form of a poster. I intentionally used a more minimalisitic modern style to set off against medieval style - which is mostly used for such thematic maps - and to improve legibility of such an amount of information. Symbols and decals linked to the characters decorate the overall map's layout.
Sources: cadaei's Shapefiles of Westeros and Essos; detailed map of theMountainGoat for feature positioning; interactive map for itinerary information
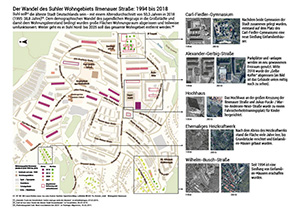
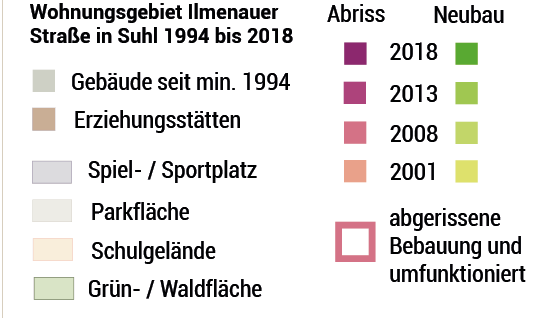
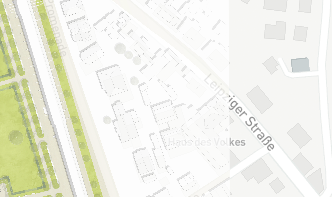
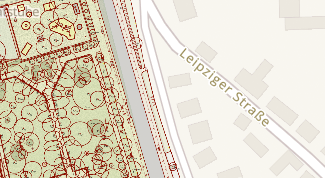
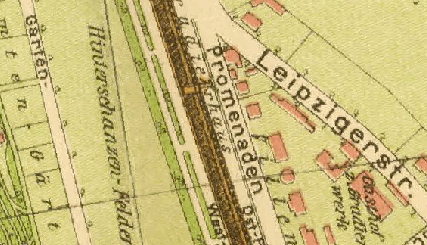
Residential District of Suhl: Ilmenauer Straße / Himmelreich
Changes of the residential district of Suhl - 1994 to 2018
QGIS | Adobe Illustrator | Adobe Photoshop | Adobe InDesign
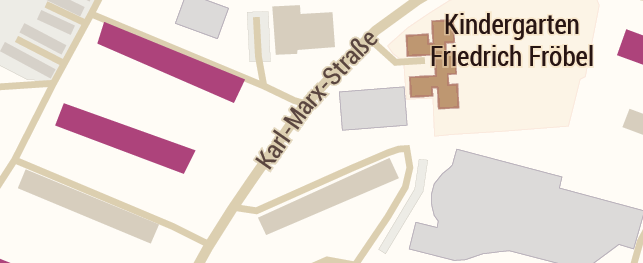
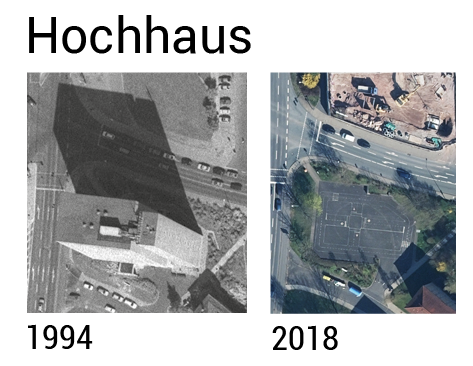
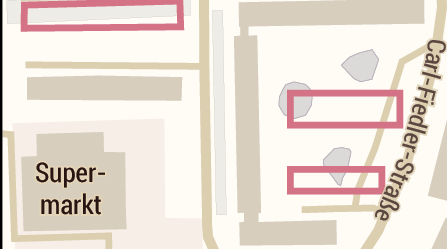
A walk through the neighbourhood I grew up in showed how much the town Suhl has changed. The demolition of many apartment buildings (which was also the reason we were forced to leave) is not only enforced in this district: residential district in the north of Suhl is meant to be bulldozed completely in the next few years to make room for private homes. Even though it seems reasonable to attract young generations again it is still bizarre to find your childhood home altered to such a degree. I wanted to know what exactly changed in the last 25 years.
Sources: aerial photographs of the open data portal of Thuringia; OSM Data for the map (OVerpassAPI); own excursions
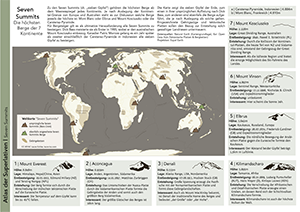
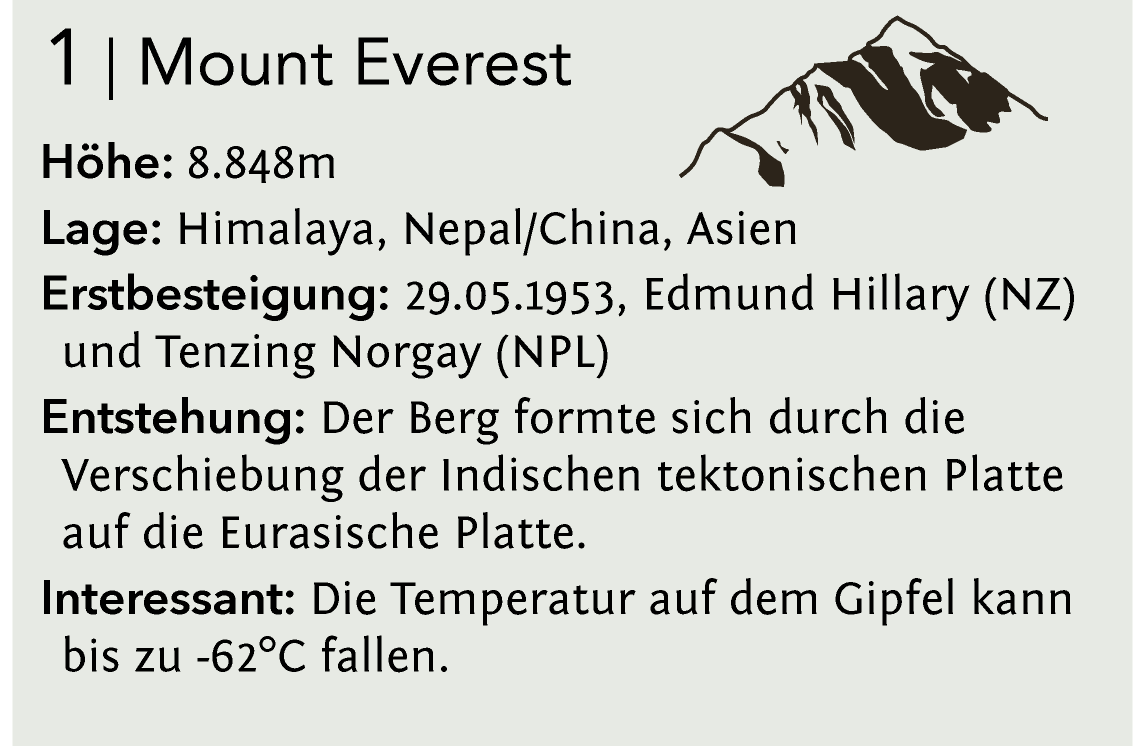
Seven Summits
The hightest mountains of the 7 continents
QGIS | Adobe Illustrator
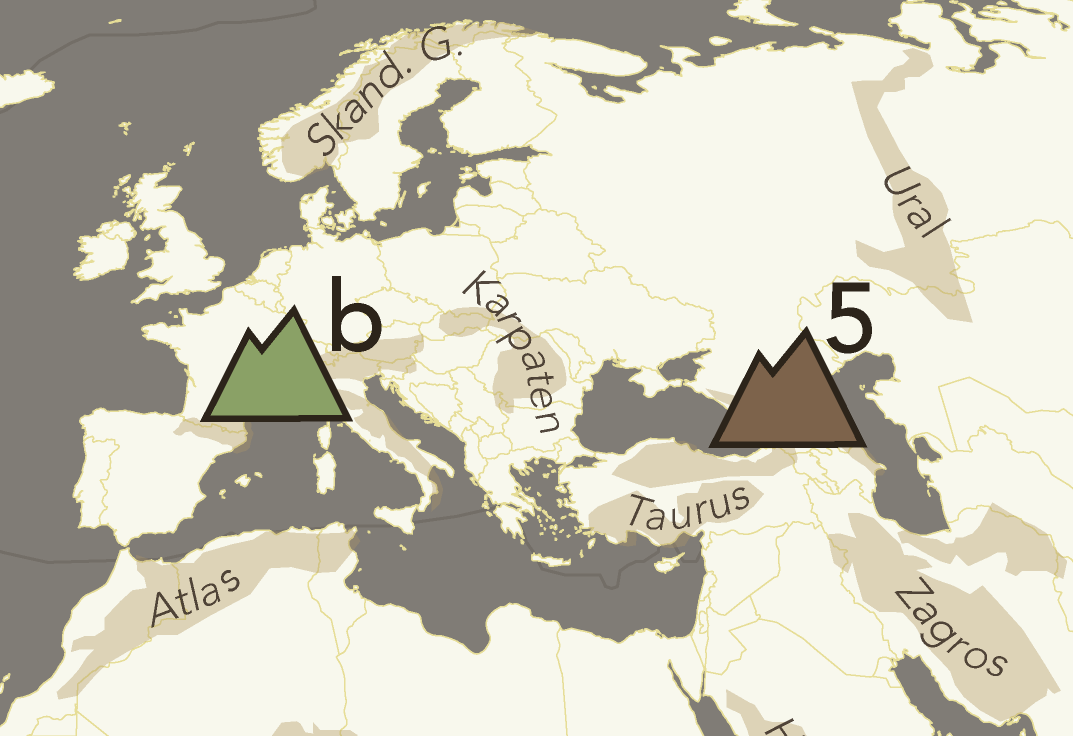
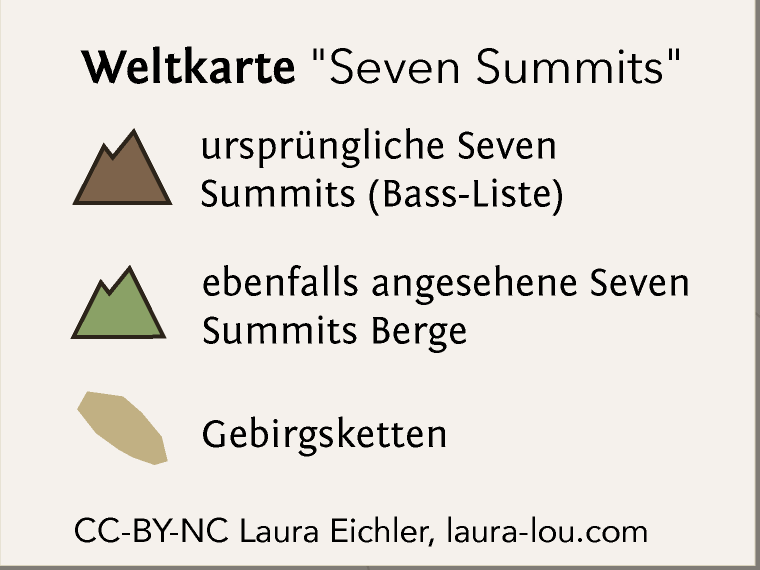
A major project of mine is the creation of many maps in consistent style and layout. Topic: Superlatives of the earth, meaning the highest buildings, longest rivers, deepest meteor crates, etc. The first map is about the highest mountains on earth. It was interesting to learn that the highest mountain in Europe can be either the Elbrus or Mont Blanc, depending on where to define the continental boundary. The mountain stencils are done by me aswell.
Sources: Shapefiles by Natural Earth Data; Projection by Equal Earth; thematic information by Wikipedia, Jörg Stingl's & Thomas Treptow's book "Seven Summits: auf den höchsten Bergen der sieben Kontinente"
Germanys Subreddits
Which subs exist for which region on reddit.com
QGIS | Adobe Illustrator
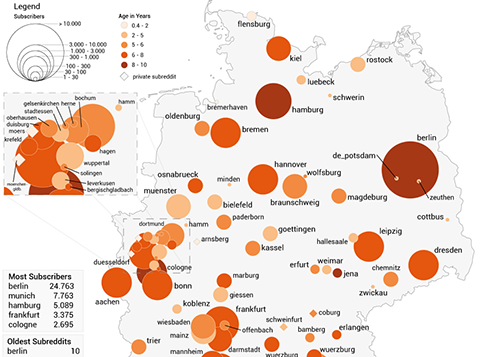
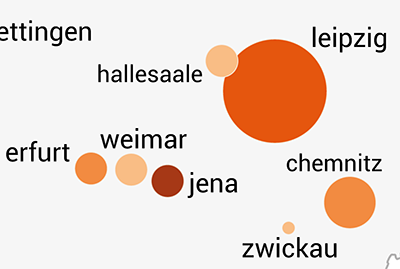
Reddit is the Internets biggest forum about any imaginable topic pooled in subreddits. To practice different map techniques I visualized the user distribution of various subreddits dedicated to a locality. With the help of redditors of /r/de I was able to review my work and complete the data.
Quellen: Shapefile by Geodatenzentrum; thematic informationen via self research on Reddit
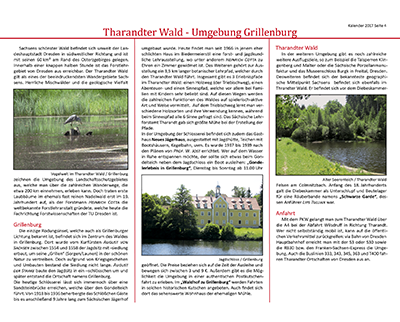
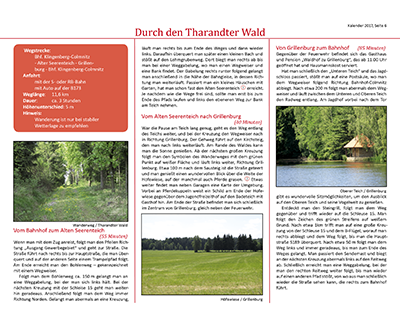
Hiking Map
Contribution to a hiking calendar 2017 of Sächsischen Zeitung
Adobe InDesign | Adobe Illustrator
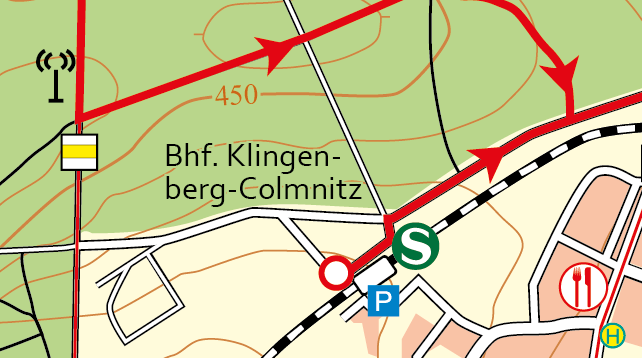
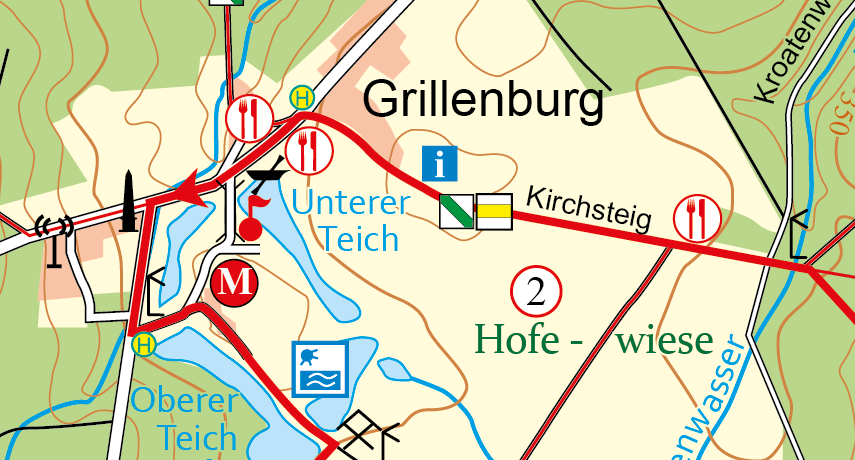
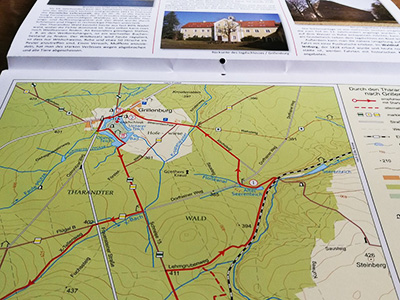
Every year the Saxonian Newspaper publishes a hiking calendar. As assignment for a bachelor's course every student had to create a hiking map with information about the area and take photos. The map was done in Adobe Illustrator, calendar layout in Adobe InDesign.
Sources: map information by Prof. Dr. Ingeborg Wilfert, TU Dresden; Text & Images by me
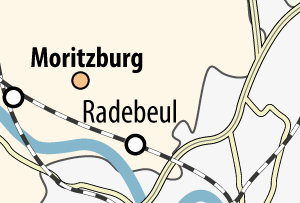
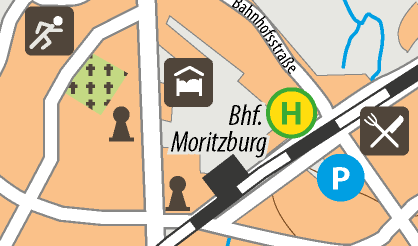
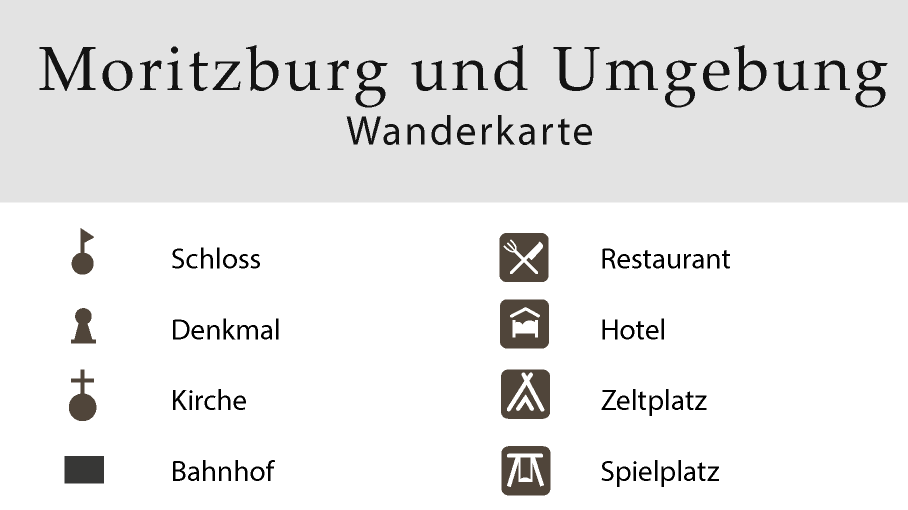
Moritzburg
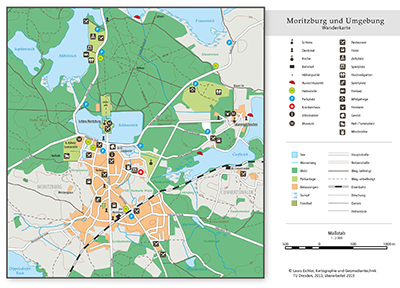
Touristic map of Moritzburg and surroundings in form of a flyer
Adobe Illustrator
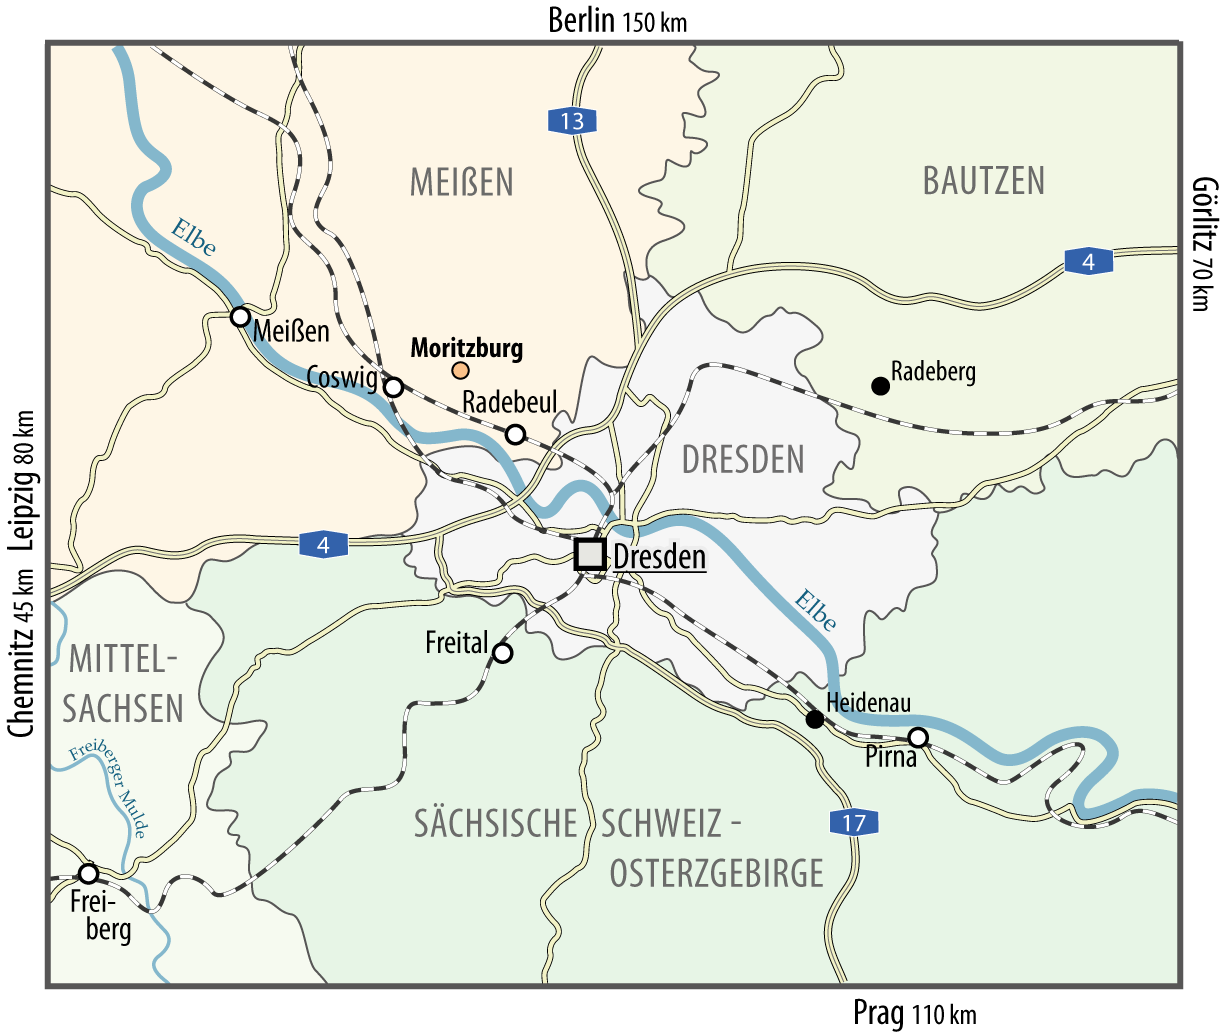
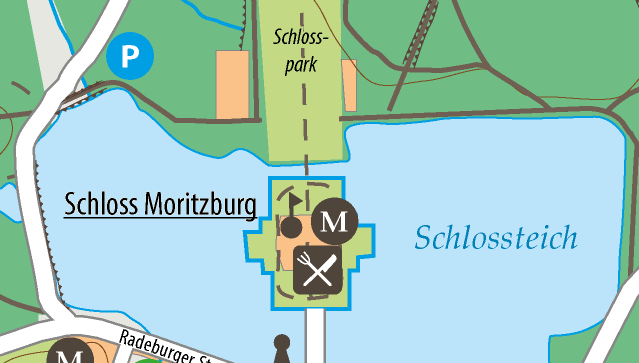
The assignment was to create a touristic hiking map with certain specifications. On the basis of scanned maps and sketches the map is to be integrated into a leaflet about Moritzburg. The overview map was used for driving directions. The original design was revised due to gained experiences and knowledge.
Sources:map information & images by Dipl.-Ing. Christine Rülke, TU Dresden; text & map by me
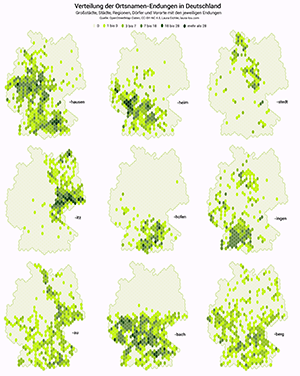
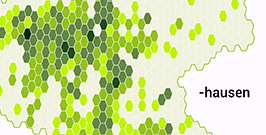
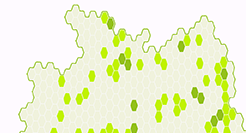
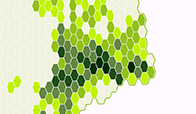
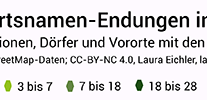
Distribution of City Name Suffixes
Metropoles, cities, towns, regions, suburbs and villages are visualized in this hexagon chloropleth map
QGIS | Adobe Illustrator
Again to train certain map visualization techniques I created this map. This time it is a chloropleth map of germany with hexagon areas. With the help of Overpass Turbi and QGIS the spatial intersection of point data and areas define the amount of locations and can be classified.
Sources: OSM data via OverpassAPI
-
Webmaps
Interacting with geo data
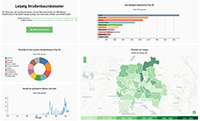
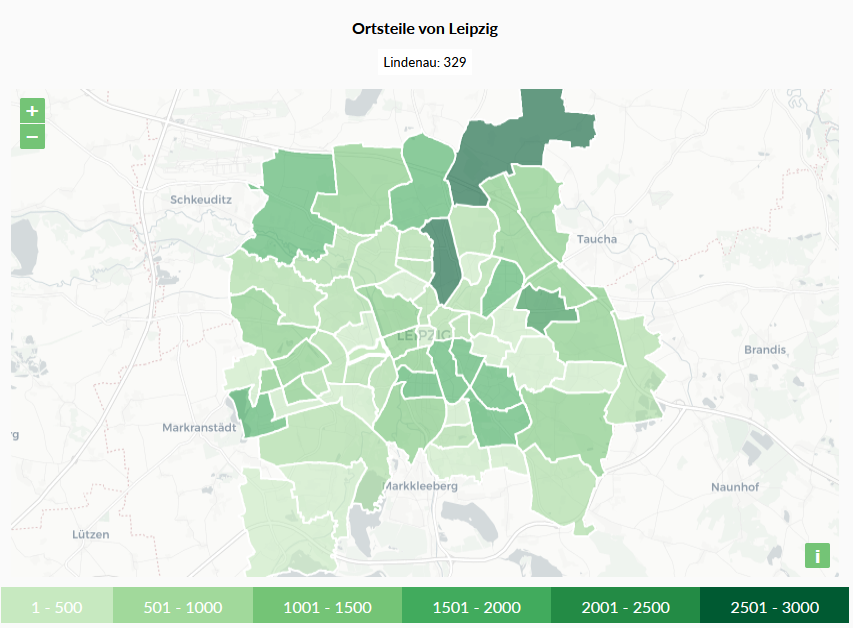
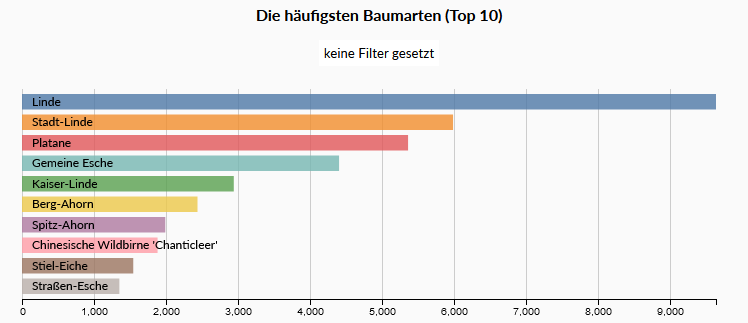
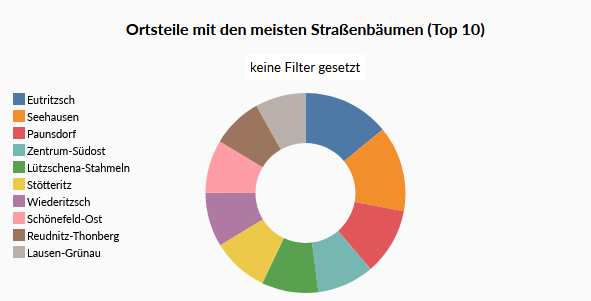
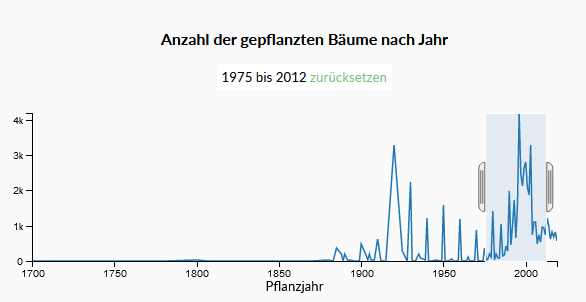
Leipzig Straßenbaumkataster Dashboard
Interaktive Übersicht von Leipzig's Bäumen im öffentlichen Raum.
Crossfilter | D3.js | dc.js | OpenLayers
To learn the mechanics of crossfilter, dc and d3 I used the open data of Leipzig. The diagrams are interacting with each other in form of filtering. The map is based on Openlayers and responds to the diagram interaction as well. Unfortunately, the project is not online anymore, which is why a live demonstration is not linked.
Sources: Shapefiles by Stadt Leipzig, Amt für Stadtgrün und Gewässer, 2020 (dl-de/by-2-0); thematic information extracted from Stadt Leipzig, Amt für Statistik und Wahlen, 2020 (dl-de/by-2-0)
Rehwaldt Landschaftarchitekten Projects
Internal visualisation of various projects; All data and rights reserved by RLA
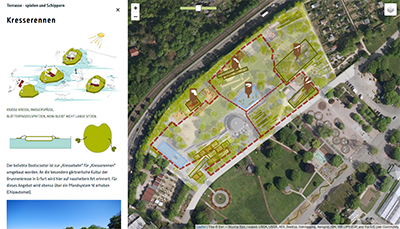
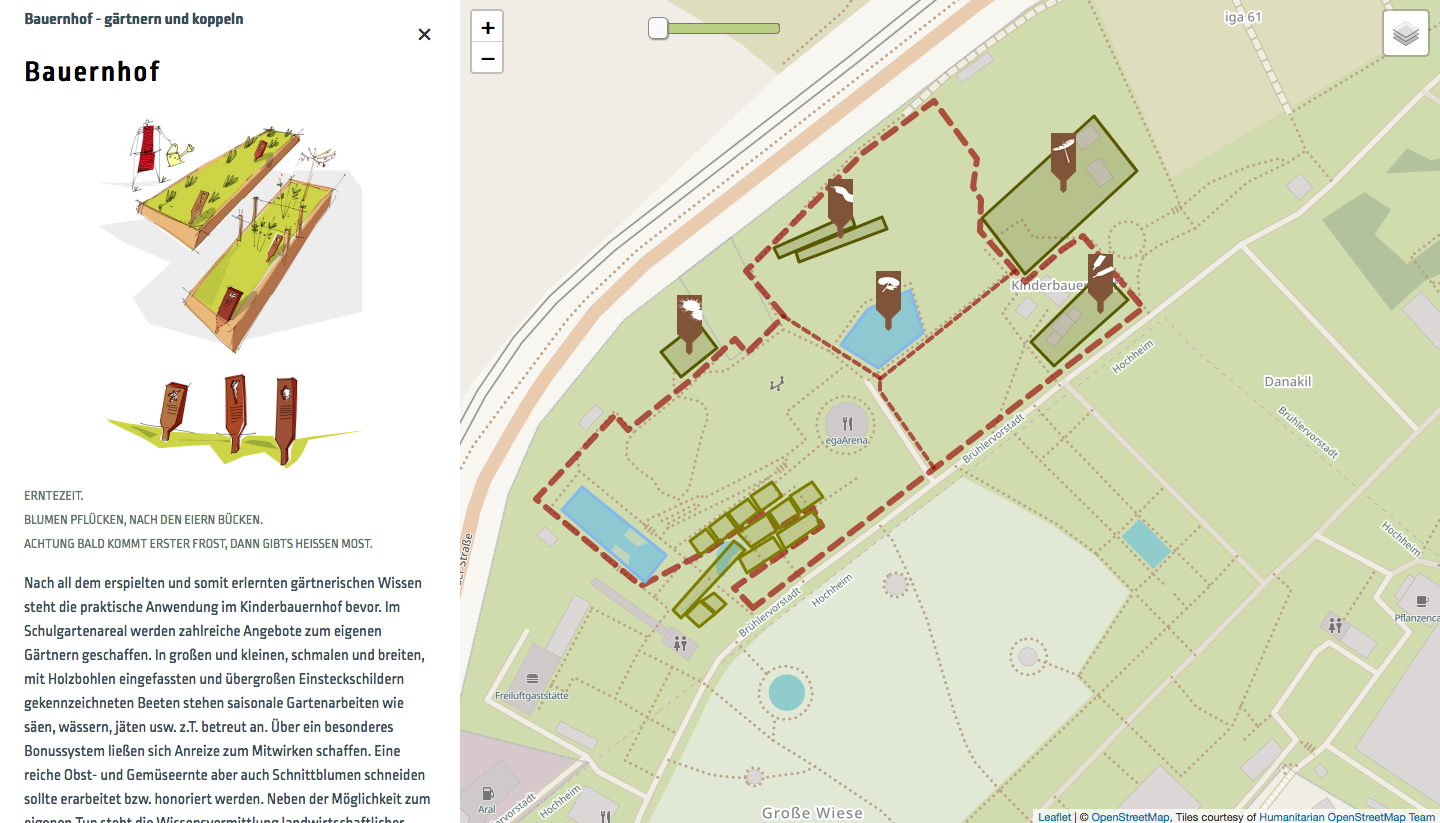
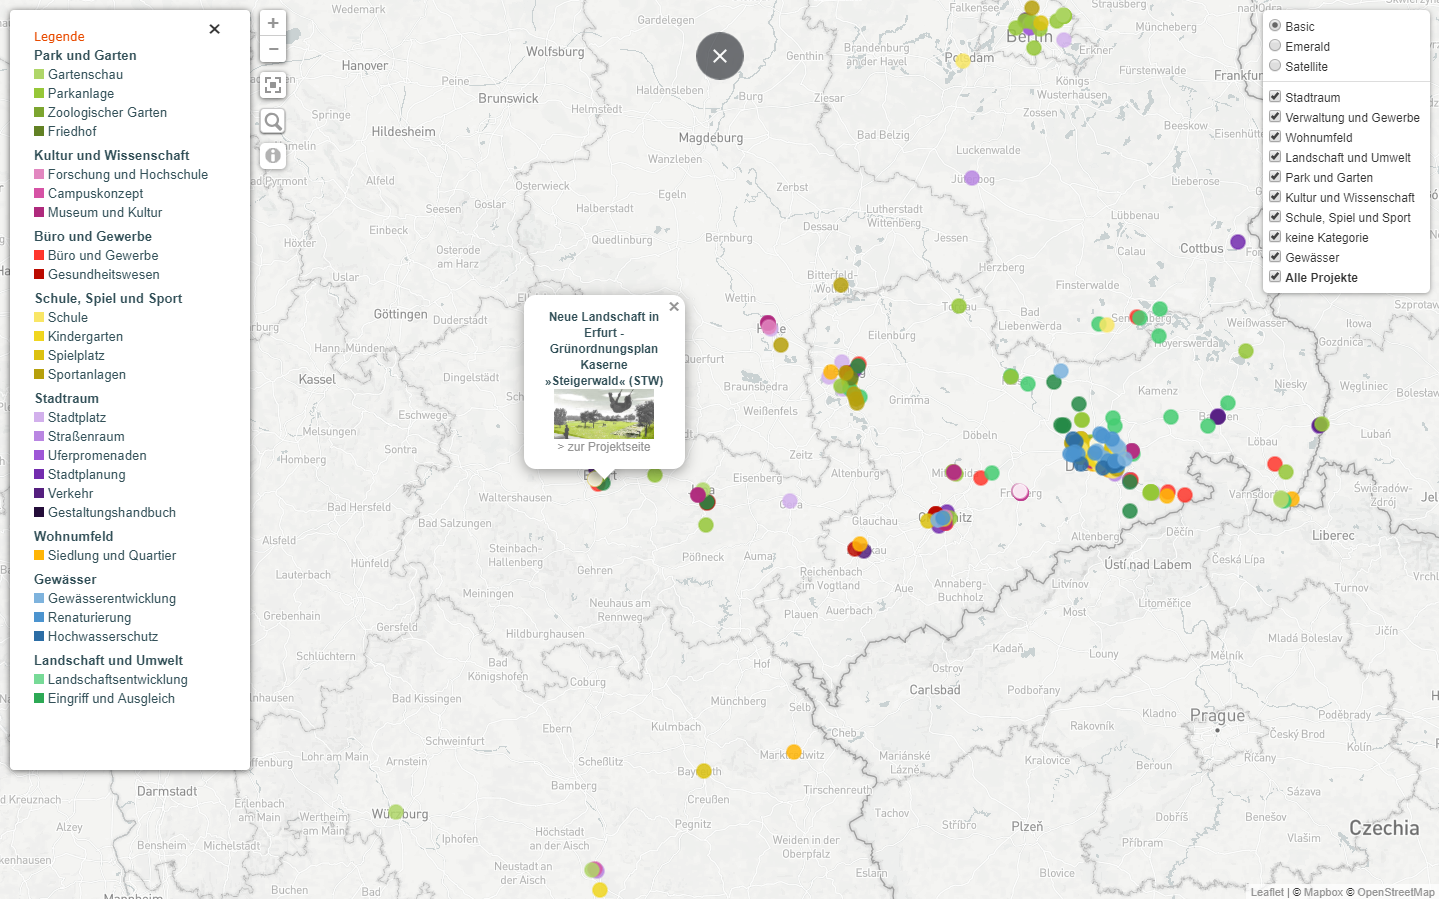
Garden themed playground in ega-Park, Erfurt || Leaflet
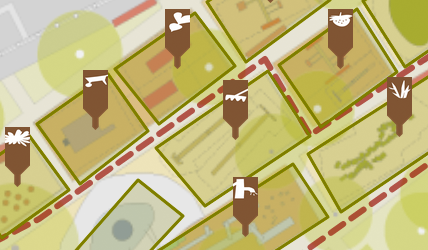
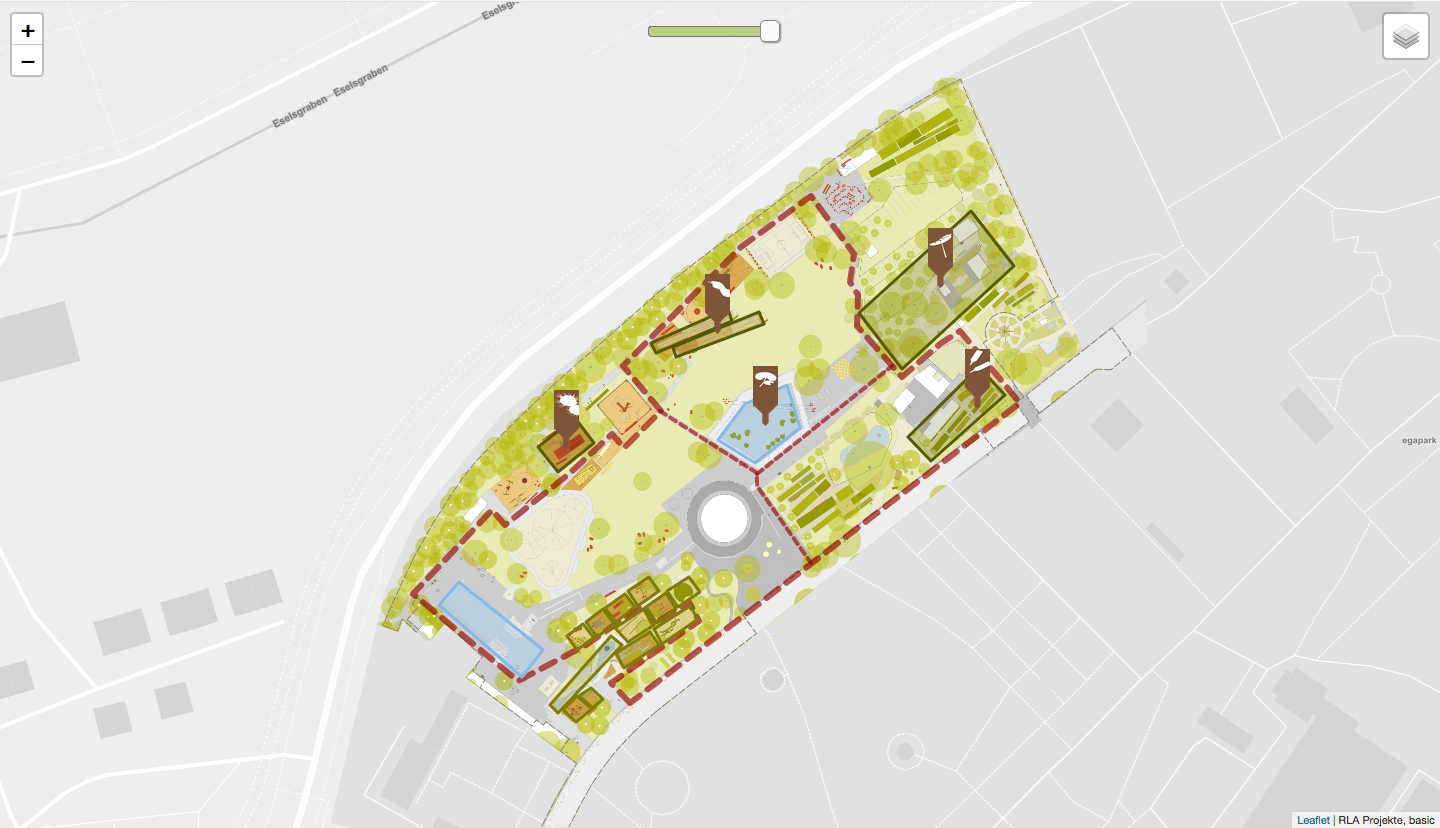
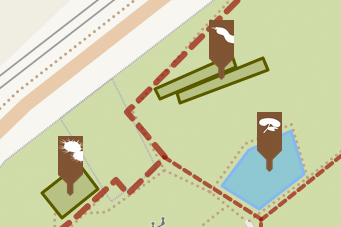
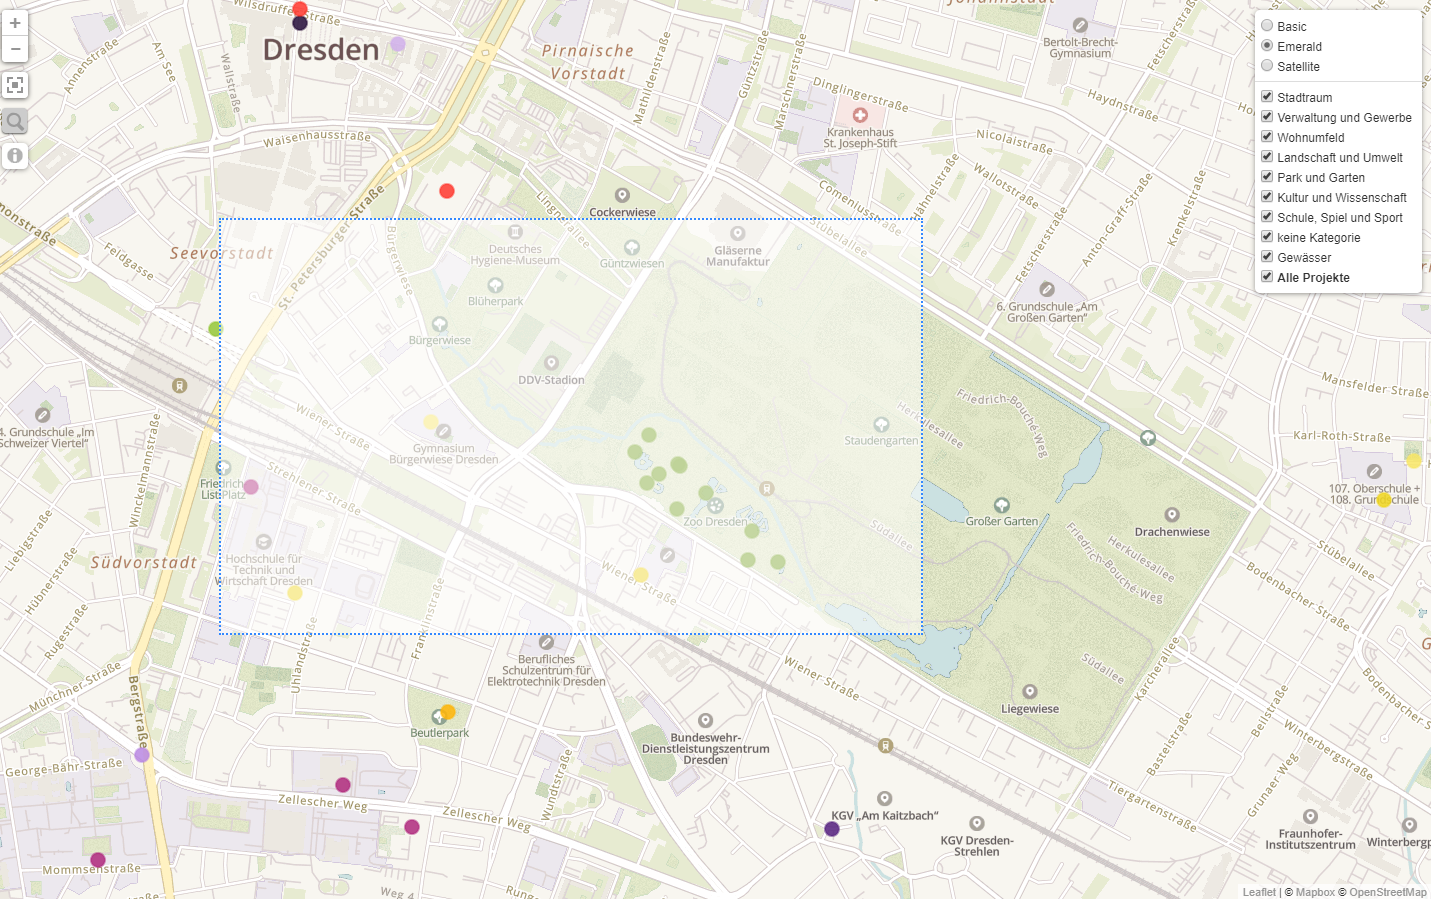
I created this interactive map to visualize the renovation of the playground in ega-Park Erfurt. A sidebar opens by clicking features and holds additional information such as sketches and concept art. A geo referenced layout plan as seperate layer lies on the base map and is adjustable in its transperency. The map is only available for cliets with login information. More information to the project.
State Horticultural show Bad Dürrenberg 2020 || Leaflet | QGIS | TileMill
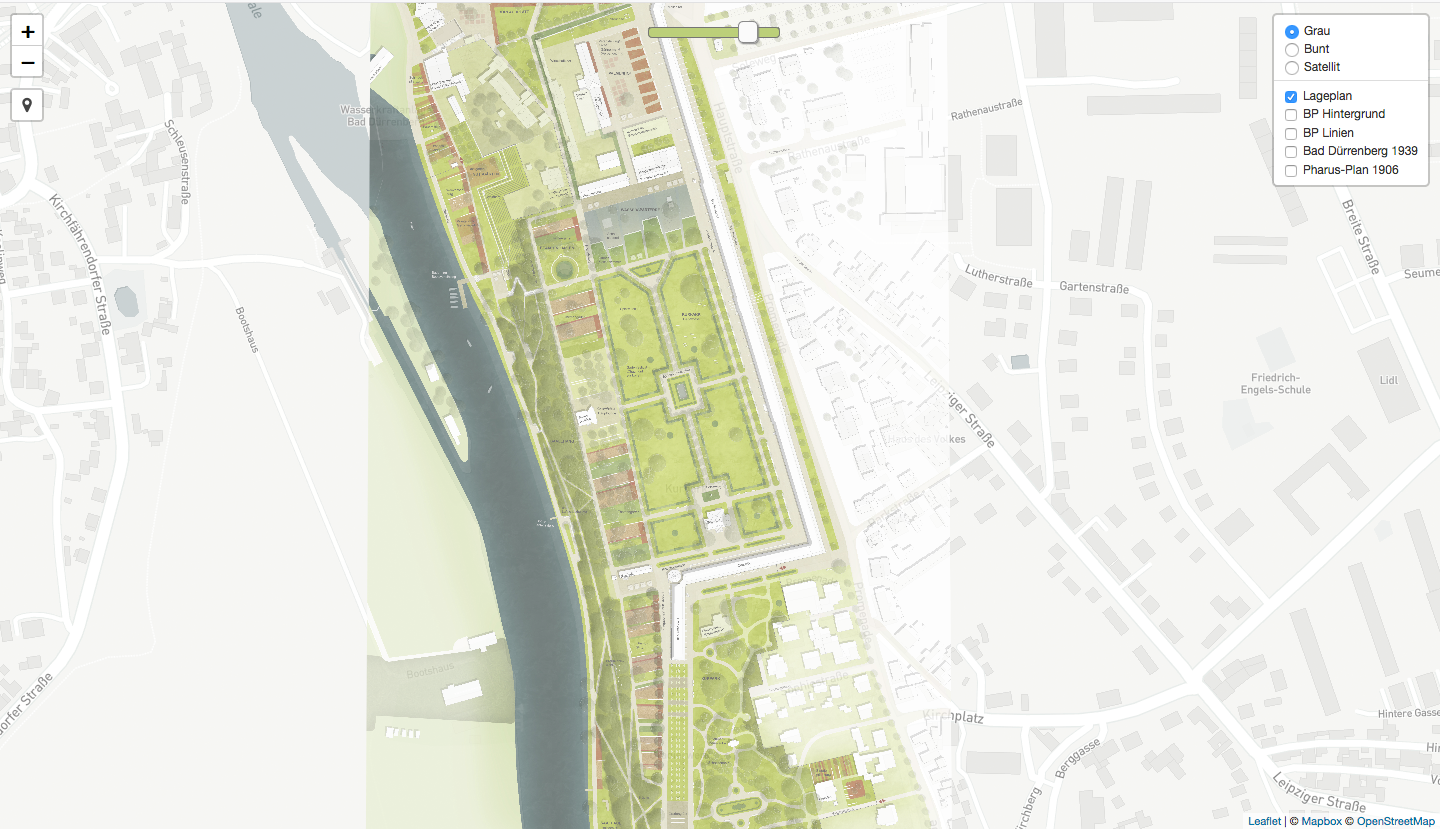
Layout plan and as-completed drawing lie as seperate geo referenced layers on the basemap and can be adjusted by slider configurations. I was able to create raster tiles from historical map scans to reduce potential mobile data usage of high resolution TIFFs. This was accomplished with QGIS and TileMill. The map is only available for cliets with login information.
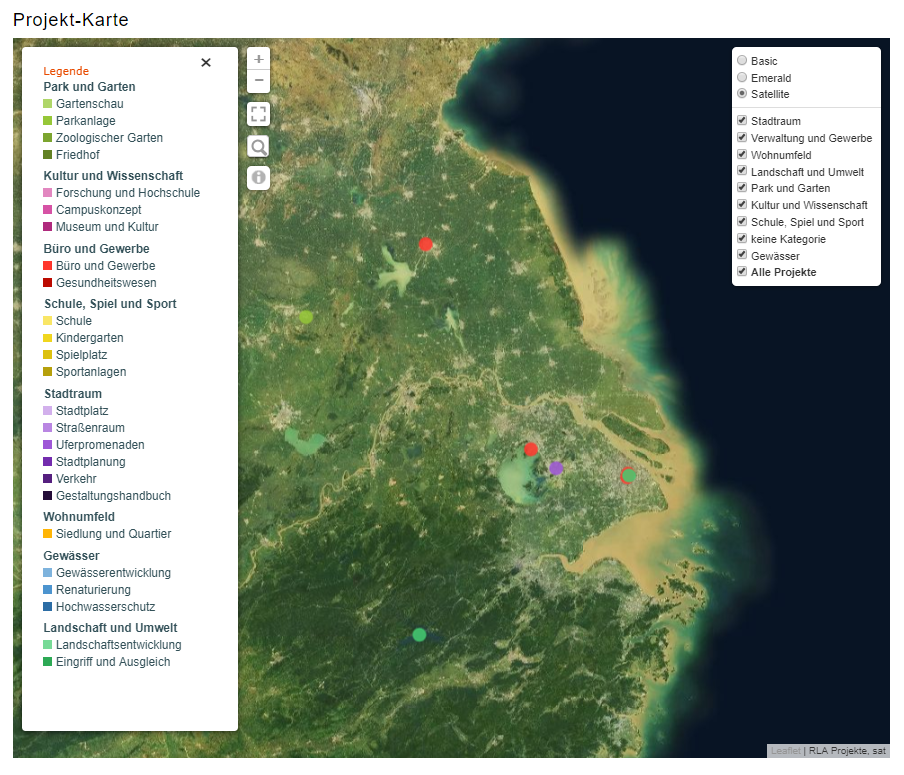
Locations of Finished Projects || Leaflet | PHP | MySQL
Part of the intranet I created for the company was the localization already finished projects to research when, where and from whom certain components were used. Various categories are coded differently in color. Another version of the point data is filterable by a time slider to determine certain periods. Because of the private nature of the intranet only staff is able to access the map.
VollbehrGIS
Landscape paintings of Ernst Vollbehr - geo located (unfinished!)
Leaflet & Plugins
As part of an 6 week internship at the Leibniz Institute for Regional Geography (IfL) it was asked to create a web application offering the possibility to interactively explore the travel of Ernst Vollbehr. Many small gimmicks freshen up the intuitve expedition through Tanzania.
Due to the shortness of the internship it was not possible to finish the project. There are still a lot of things to do (e.g. Thumbnails). At the moment it is only optimized for Mozilla Firefox & Google Chrome!
Statistical Thuringia: Population
SVG based map shows the county districts of Thuringia and interactive statistical information
SVG
TU Vienna assignment for the master's programme "International Cartography": an interactive map without georeferenced data and everything based on SVG. Additional information are given on the right. Not responsive and optimized for desktop browsers!
Travel Bucket List
A web map about places I've been to, lived at and aim to travel to (state Mid 2019)
Leaflet
A small assignment to create a simple web map. Here I played around with custom pin markers, geometry areas and lines categorized in places I've been to, lived at and aim to travel to.
Statistical Austria: Income
A simple chloropleth map of Austrias counties based D3
D3
TU Vienna assignment as part of the master's programme "International Cartography": an interactive map based on JSON data developed to switch between gender related information about the income.
-
Creativity
Design & Misc
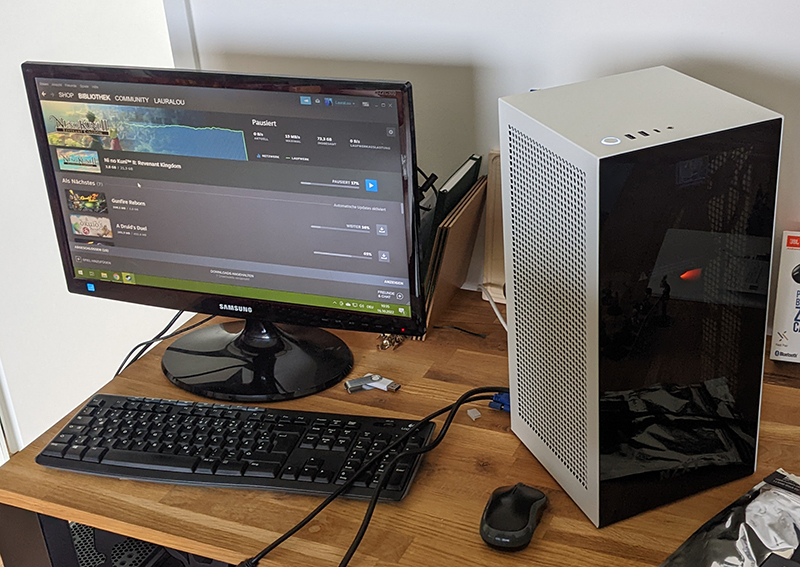
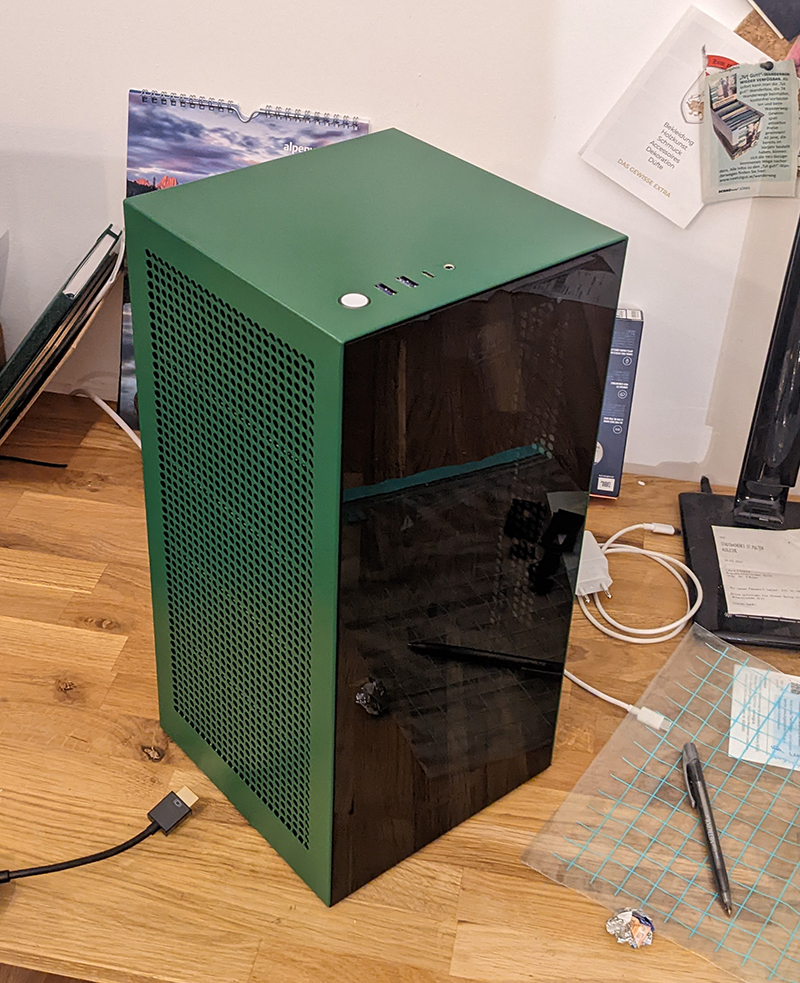
Custom PC case
First PC built
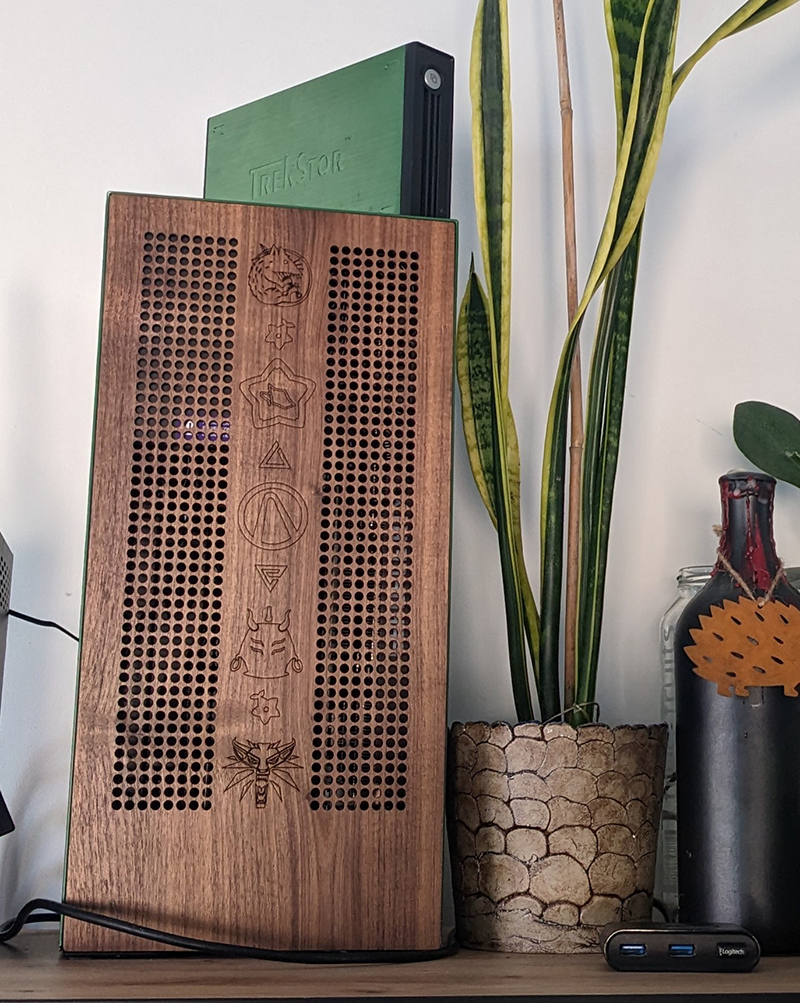
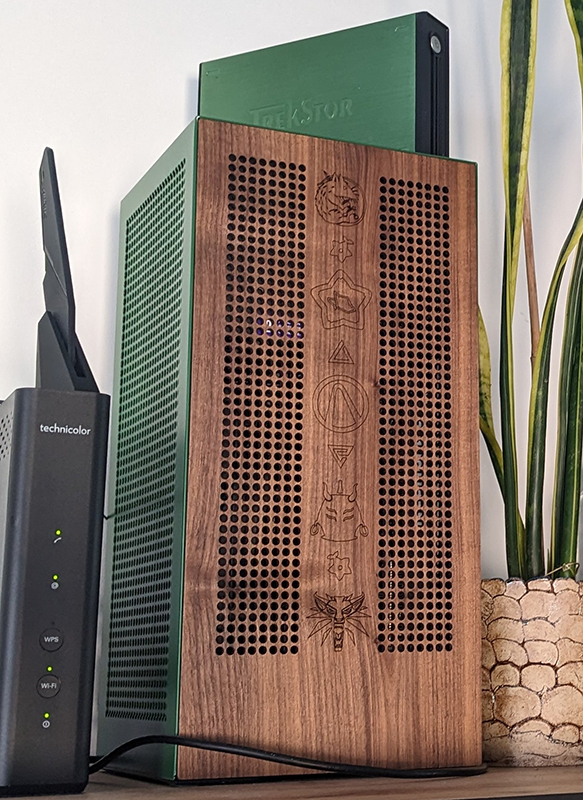
Waiting for the economy to get back on track after covid took a long time. I researched parts and most importantly cases. I wanted a PC with more RAM, better GPX but also have it compact. This is the outcome. I got the NXT case and my husband did the realization of my customizing as he has the workspace and ressources due to his job: painting it green & creating a wooden front panel. My collegue 3D-printed the connectors of the panel to the case and his collegue used his laser to engrave the gaming symbols, that I prepared digitally. I love how it turned out and fits into our living room arrangement.
Symbols (top to bottom): Tails of Iron, Stardew Valley, Spiritfarer, Witcher 3, Borderlands 2, Witcher 3, Wytchwood, Stardew Valley, Witcher 3.
Acrylic Painting
Getting to knwo techniques to someday in the distant future create a mountain panorama map
Mountain panorama maps are my favorite kind of maps and my dream is to someday create one of my own. Unfortunately it is nearly impossible to research on how to create one and in the end it comes down to painting and distortion.
In summer 2022 I was fortunate to meet a well known mountain panorama map creator and was shown some insights in the process of creating such a map. I was intrigued and impressed. This meet up motivated me to finally get into the making of such a map, knowing I am going to fail many times before I create something I am satisfied with.
First step I took was a course in acrylic painting (the only painting course available around here) to get to know the handling of colors, a feel of using a brush and how to use shadow. On the left side you see the first result, indspired by a flyer motive of an art exhibit in Gmünd.
DIY Wedding
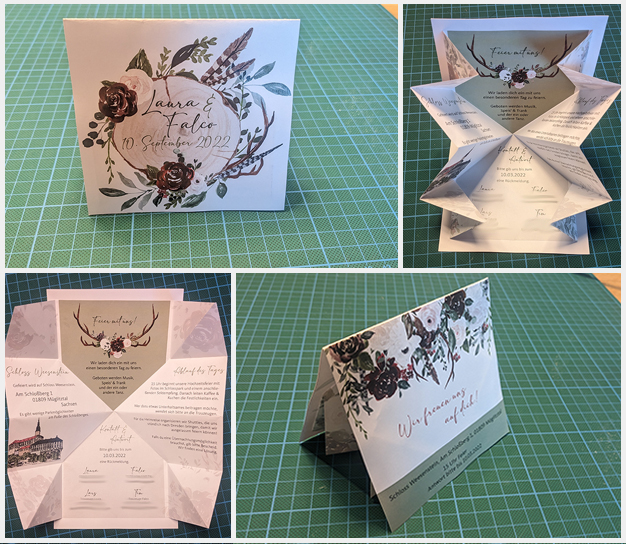
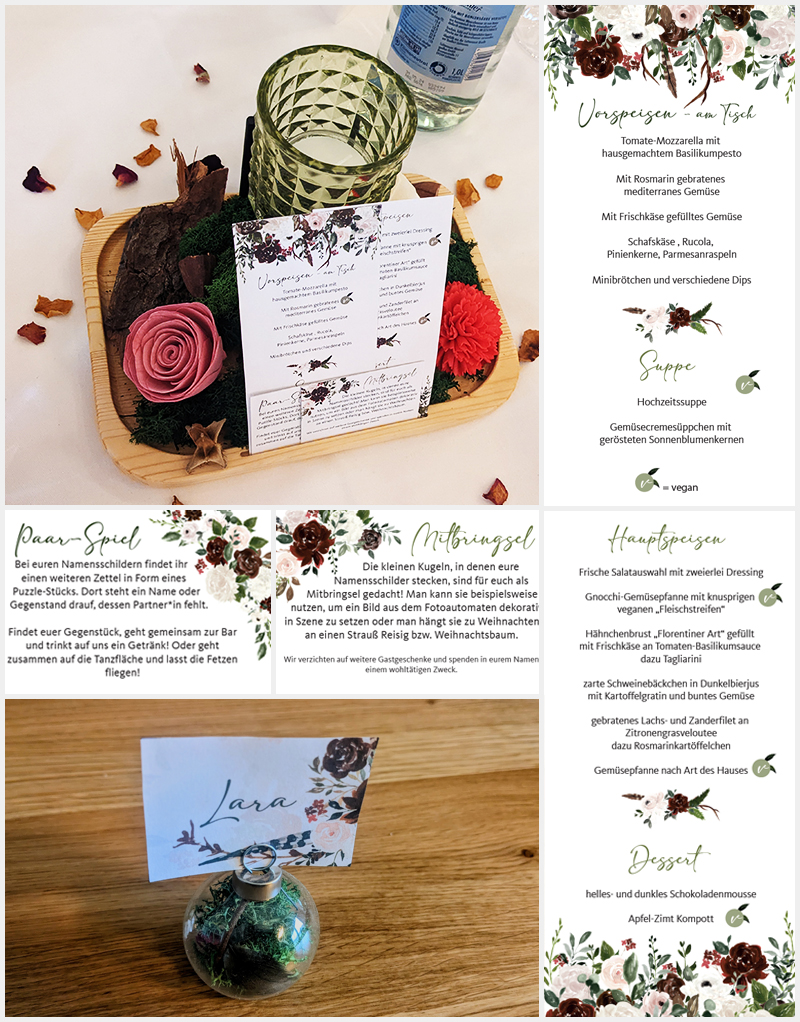
An approach that burnt me out - creativity-wise
Adobe InDesign | Adobe Illustrator | watercolor clipart by OpiaStudioDesigns (Etsy)
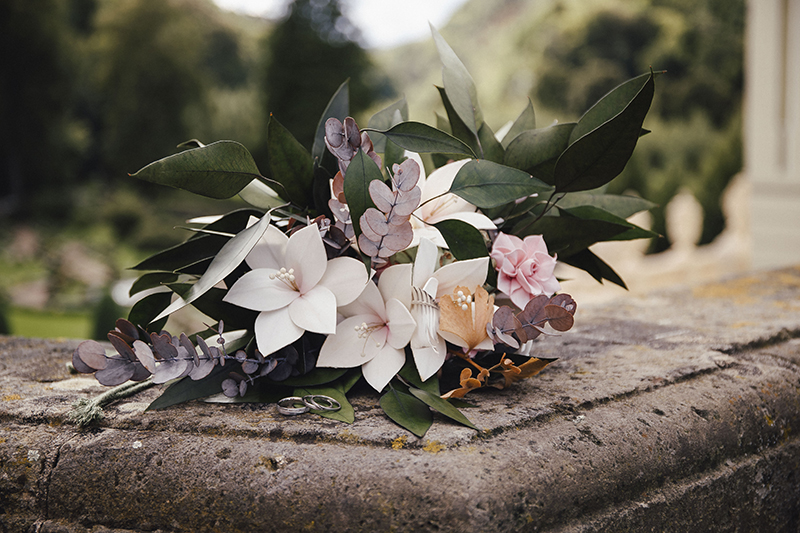
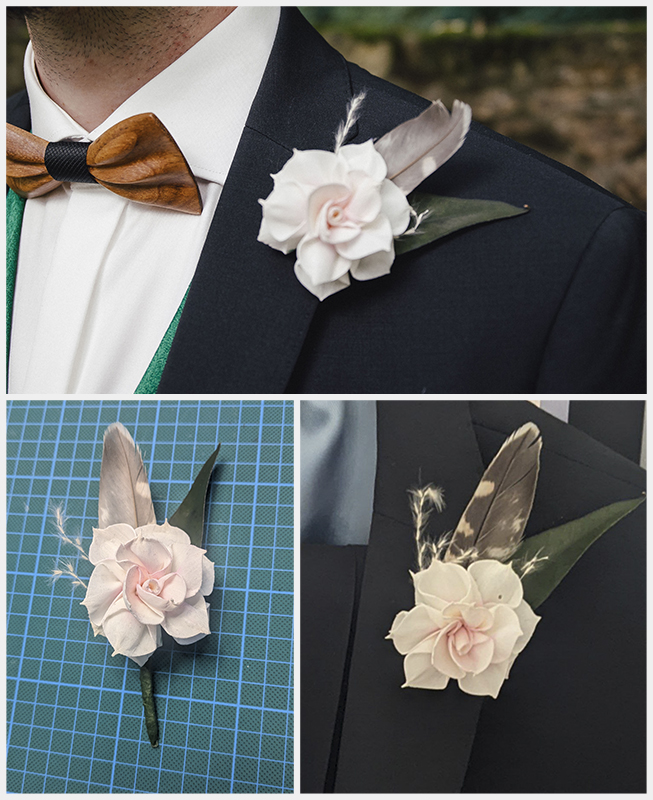
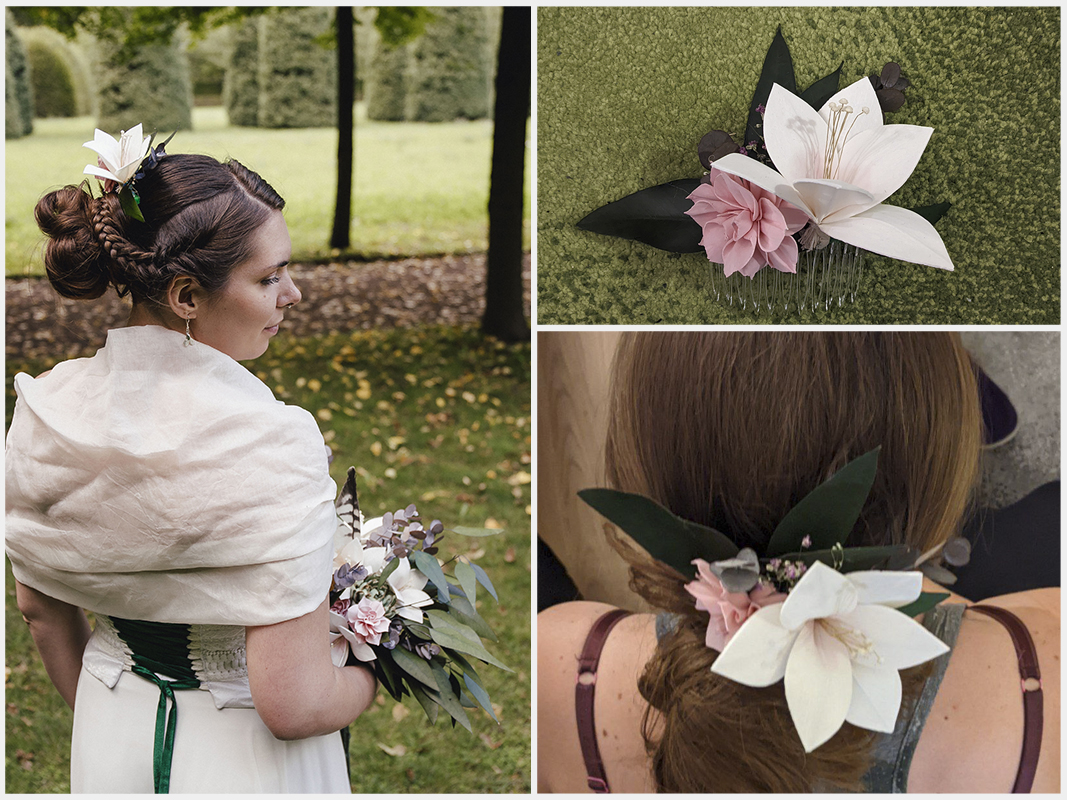
When you plan a wedding, and a low key one at that, you would think that it is not a big deal. But naturally you browse some sites and pinterest for inspiration and reckon 'Well, I can do that and thats it! No stress at all." In the end I crafted and designed everything myself and my now-husband brought me back to earth when I had yet another idea. I am super proud of what I accomplished with some help of my husband and just want to show off (as I do not have social media).
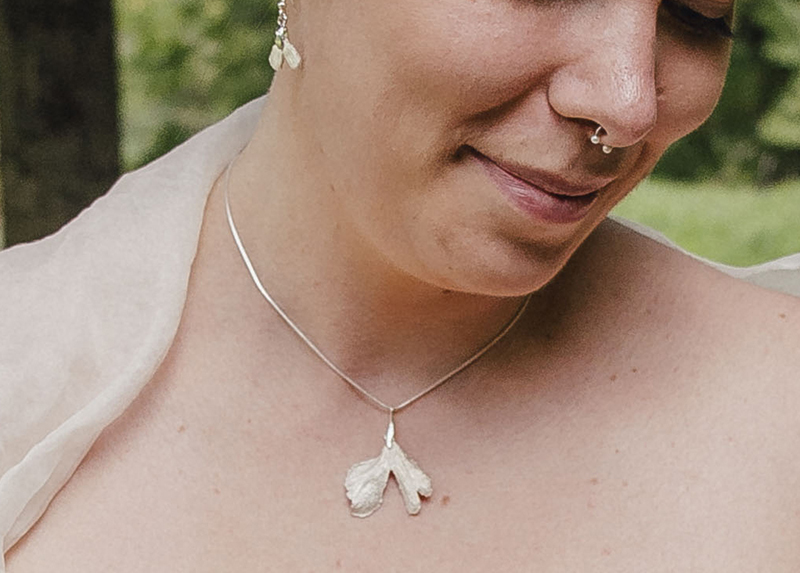
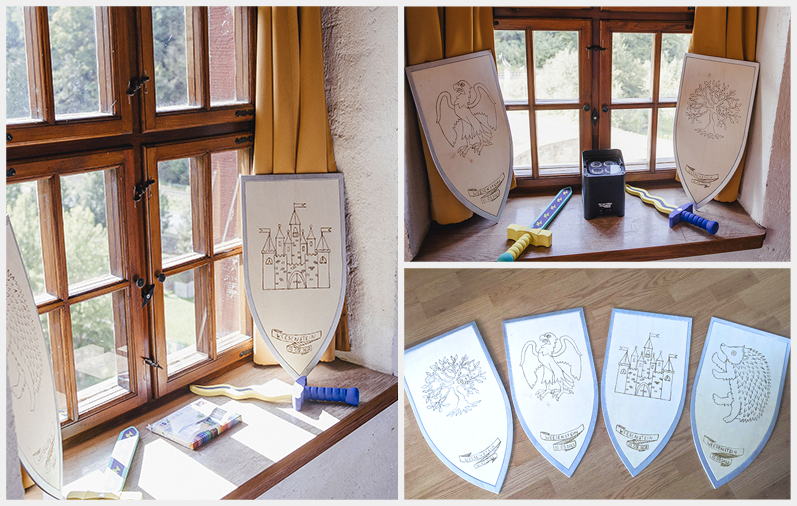
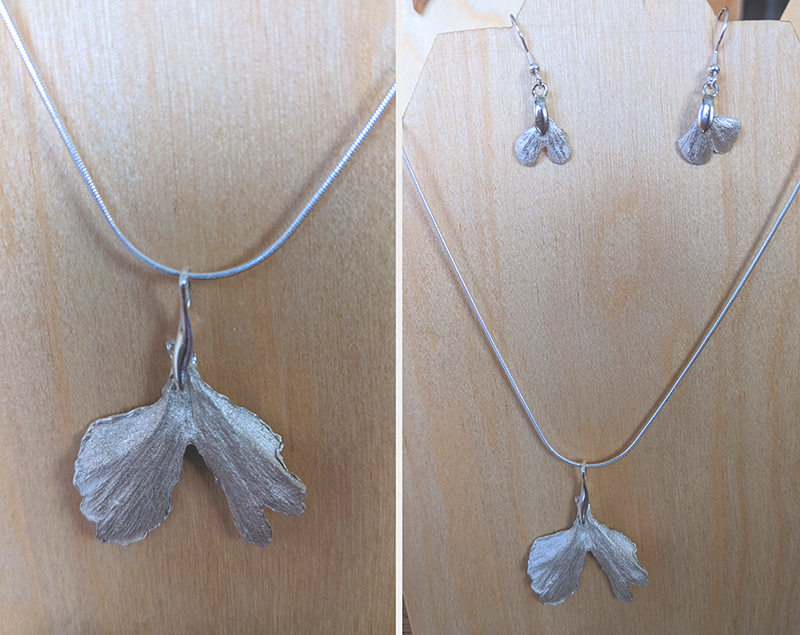
Items, I designed/crafted: save the dates; invites (very intense folding for 50 invites); name tags and puzzle game; silver jevelry for myself, my mom and my mother in law; bridal bouquet; boutinettes for the groom, my fathers & stepfather as well as father in law; decoration on the table; wooden shields for the kids; name tag holders; ...
Handmade Jewelry
Different materials and different techniques
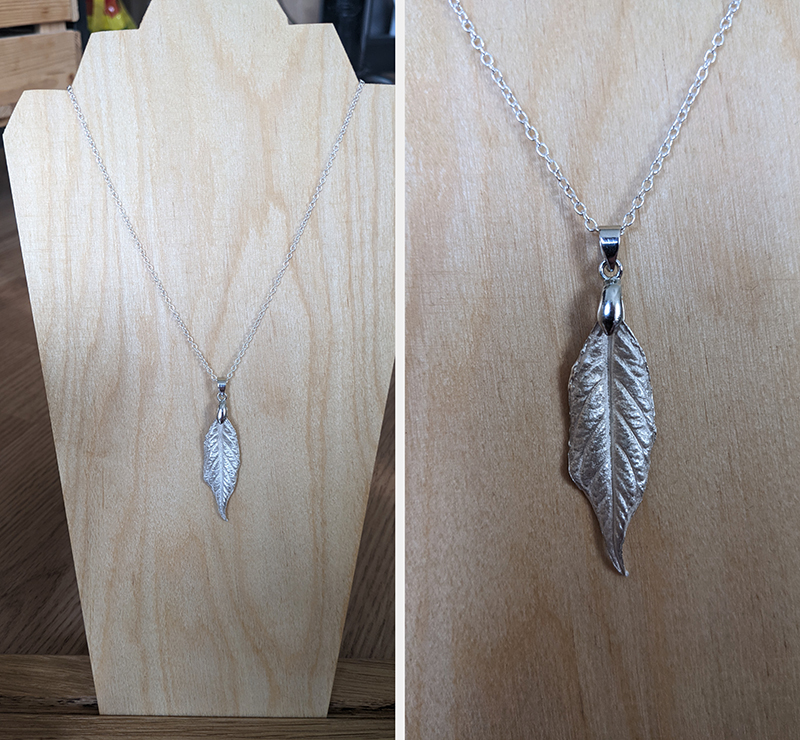
As mentioned above I created my own Jewelry for my wedding. For that I used Silver Art Clay and made an imprint of Ginkgo leaves from our bonsai tree. The same I did with leaves from blackberry bushes for my mother in law, and poinsette for my mother. It took some practice to get a hole in the delicate leaves but it was worth it!
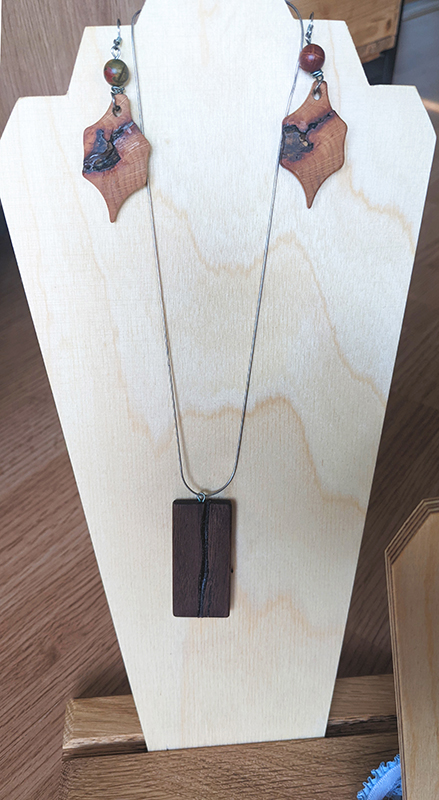
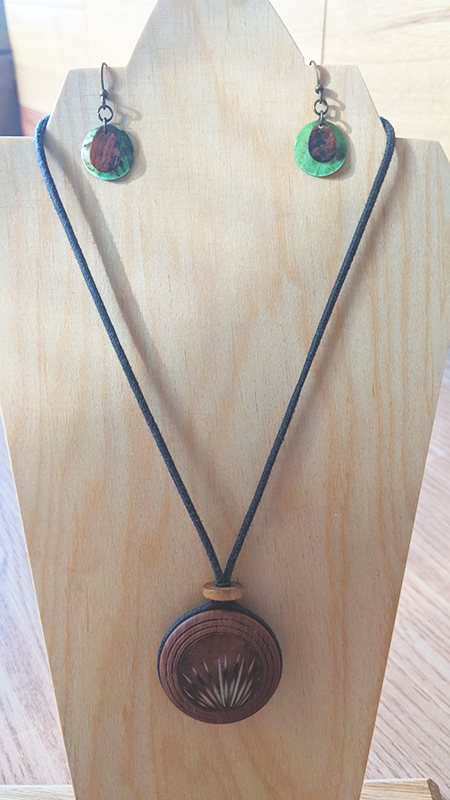
Other than that, my husband and me used pieces of wood and resin to create unique pendants, e.g. the one with spikes of my pet hedgehog or varius earrings.
Mountain Rescue Service Bavaria Booklet
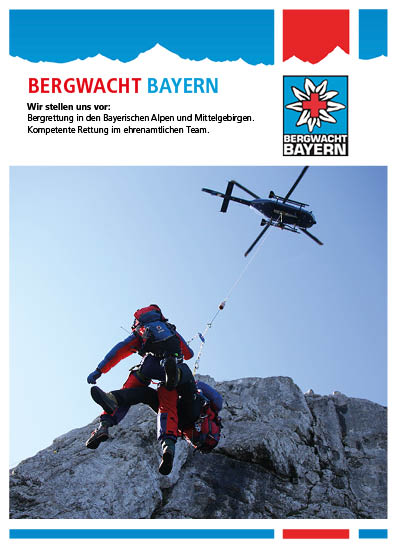
An exercise in using Corporate Design guidelines
Adobe InDesign | Adobe Illustrator
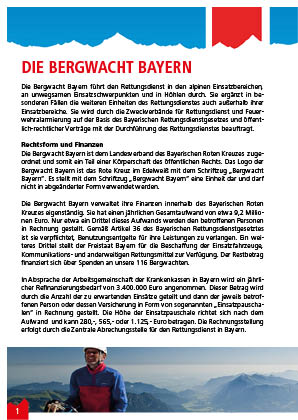
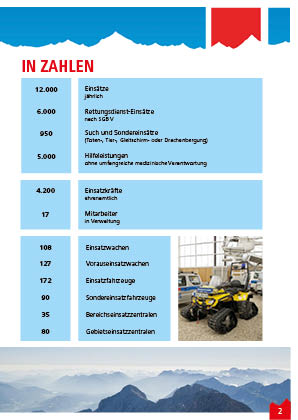
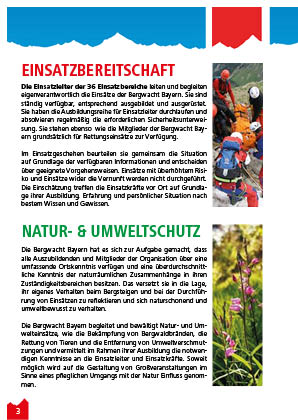
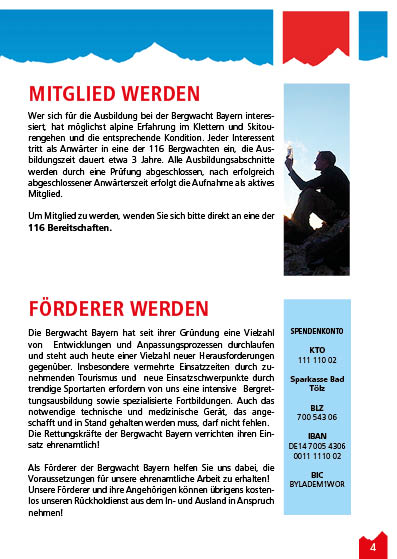
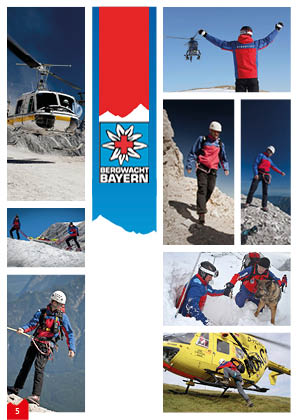
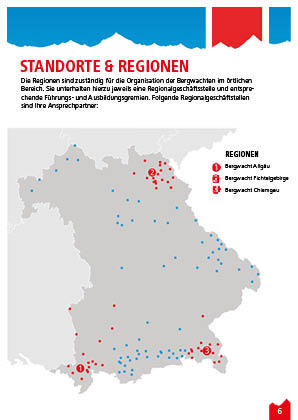
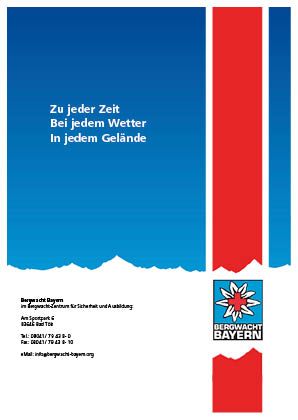
The task was to apply guidelines of a corporate design (CD) to design a booklet. I decided for the mountain rescue service Bavaria, because their CD is outlined thouroughly. Focus was the design, not the content. Therefore, pictures and texts were copied from their website and only serve for demonstration purposes. The complete booklet can viewed as PDF with permission of director R. Ampenberger. All rights reserved by them.
